Onsite Use of Recycled Asphalt Pavement Materials and Geocells to ...
Onsite Use of Recycled Asphalt Pavement Materials and Geocells to ...
Onsite Use of Recycled Asphalt Pavement Materials and Geocells to ...

You also want an ePaper? Increase the reach of your titles
YUMPU automatically turns print PDFs into web optimized ePapers that Google loves.
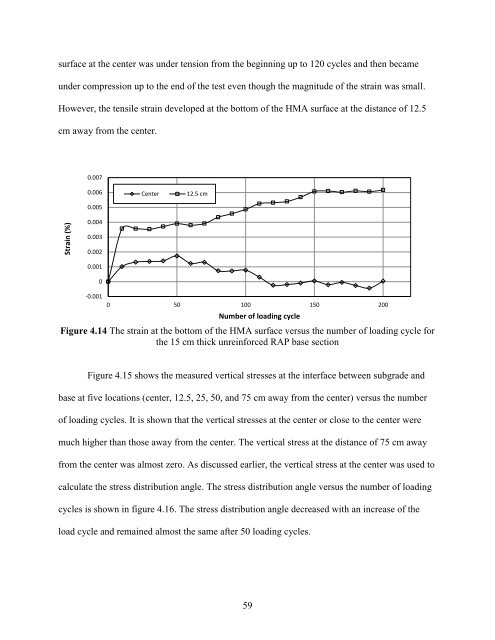
surface at the center was under tension from the beginning up <strong>to</strong> 120 cycles <strong>and</strong> then became<br />
under compression up <strong>to</strong> the end <strong>of</strong> the test even though the magnitude <strong>of</strong> the strain was small.<br />
However, the tensile strain developed at the bot<strong>to</strong>m <strong>of</strong> the HMA surface at the distance <strong>of</strong> 12.5<br />
cm away from the center.<br />
Strain (%)<br />
0.007<br />
0.006<br />
0.005<br />
0.004<br />
0.003<br />
0.002<br />
0.001<br />
0<br />
-0.001<br />
Center 12.5 cm<br />
0 50 100 150 200<br />
Number <strong>of</strong> loading cycle<br />
Figure 4.14 The strain at the bot<strong>to</strong>m <strong>of</strong> the HMA surface versus the number <strong>of</strong> loading cycle for<br />
the 15 cm thick unreinforced RAP base section<br />
Figure 4.15 shows the measured vertical stresses at the interface between subgrade <strong>and</strong><br />
base at five locations (center, 12.5, 25, 50, <strong>and</strong> 75 cm away from the center) versus the number<br />
<strong>of</strong> loading cycles. It is shown that the vertical stresses at the center or close <strong>to</strong> the center were<br />
much higher than those away from the center. The vertical stress at the distance <strong>of</strong> 75 cm away<br />
from the center was almost zero. As discussed earlier, the vertical stress at the center was used <strong>to</strong><br />
calculate the stress distribution angle. The stress distribution angle versus the number <strong>of</strong> loading<br />
cycles is shown in figure 4.16. The stress distribution angle decreased with an increase <strong>of</strong> the<br />
load cycle <strong>and</strong> remained almost the same after 50 loading cycles.<br />
59