Thesis Title: Subtitle - NMR Spectroscopy Research Group
Thesis Title: Subtitle - NMR Spectroscopy Research Group
Thesis Title: Subtitle - NMR Spectroscopy Research Group

Create successful ePaper yourself
Turn your PDF publications into a flip-book with our unique Google optimized e-Paper software.
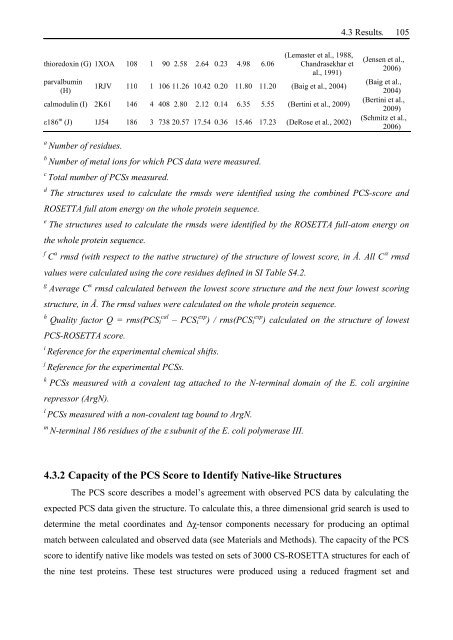
thioredoxin (G) 1XOA 108 1 90 2.58 2.64 0.23<br />
parvalbumin<br />
(H)<br />
4.98 6.06<br />
(Lemaster et al., 1988,<br />
Chandrasekhar et<br />
al., 1991)<br />
1RJV 110 1 106 11.26 10.42 0.20 11.80 11.20 (Baig et al., 2004)<br />
calmodulin (I) 2K61 146 4 408 2.80 2.12 0.14 6.35 5.55 (Bertini et al., 2009)<br />
ε186 m (J) 1J54 186 3 738 20.57 17.54 0.36 15.46 17.23 (DeRose et al., 2002)<br />
a Number of residues.<br />
b Number of metal ions for which PCS data were measured.<br />
c Total number of PCSs measured.<br />
4.3 Results. 105<br />
(Jensen et al.,<br />
2006)<br />
(Baig et al.,<br />
2004)<br />
(Bertini et al.,<br />
2009)<br />
(Schmitz et al.,<br />
2006)<br />
d The structures used to calculate the rmsds were identified using the combined PCS-score and<br />
ROSETTA full atom energy on the whole protein sequence.<br />
e The structures used to calculate the rmsds were identified by the ROSETTA full-atom energy on<br />
the whole protein sequence.<br />
f C α rmsd (with respect to the native structure) of the structure of lowest score, in Å. All C rmsd<br />
values were calculated using the core residues defined in SI Table S4.2.<br />
g Average C α rmsd calculated between the lowest score structure and the next four lowest scoring<br />
structure, in Å. The rmsd values were calculated on the whole protein sequence.<br />
h Quality factor Q = rms(PCSi cal – PCSi exp ) / rms(PCSi exp ) calculated on the structure of lowest<br />
PCS-ROSETTA score.<br />
i Reference for the experimental chemical shifts.<br />
j Reference for the experimental PCSs.<br />
k PCSs measured with a covalent tag attached to the N-terminal domain of the E. coli arginine<br />
repressor (ArgN).<br />
l PCSs measured with a non-covalent tag bound to ArgN.<br />
m N-terminal 186 residues of the subunit of the E. coli polymerase III.<br />
4.3.2 Capacity of the PCS Score to Identify Native-like Structures<br />
The PCS score describes a model’s agreement with observed PCS data by calculating the<br />
expected PCS data given the structure. To calculate this, a three dimensional grid search is used to<br />
determine the metal coordinates and Δχ-tensor components necessary for producing an optimal<br />
match between calculated and observed data (see Materials and Methods). The capacity of the PCS<br />
score to identify native like models was tested on sets of 3000 CS-ROSETTA structures for each of<br />
the nine test proteins. These test structures were produced using a reduced fragment set and