Thesis Title: Subtitle - NMR Spectroscopy Research Group
Thesis Title: Subtitle - NMR Spectroscopy Research Group
Thesis Title: Subtitle - NMR Spectroscopy Research Group

Create successful ePaper yourself
Turn your PDF publications into a flip-book with our unique Google optimized e-Paper software.
2.4 Results. 37<br />
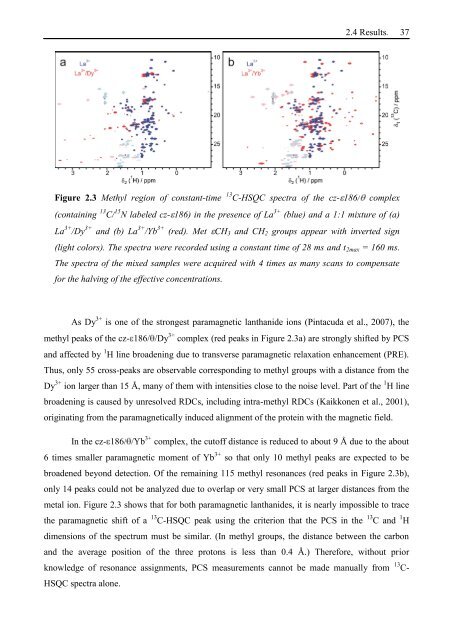
Figure 2.3 Methyl region of constant-time 13 C-HSQC spectra of the cz- 186/ complex<br />
(containing 13 C/ 15 N labeled cz- 186) in the presence of La 3+ (blue) and a 1:1 mixture of (a)<br />
La 3+ /Dy 3+ and (b) La 3+ /Yb 3+ (red). Met CH3 and CH2 groups appear with inverted sign<br />
(light colors). The spectra were recorded using a constant time of 28 ms and t2max = 160 ms.<br />
The spectra of the mixed samples were acquired with 4 times as many scans to compensate<br />
for the halving of the effective concentrations.<br />
As Dy 3+ is one of the strongest paramagnetic lanthanide ions (Pintacuda et al., 2007), the<br />
methyl peaks of the cz- 186/ /Dy 3+ complex (red peaks in Figure 2.3a) are strongly shifted by PCS<br />
and affected by 1 H line broadening due to transverse paramagnetic relaxation enhancement (PRE).<br />
Thus, only 55 cross-peaks are observable corresponding to methyl groups with a distance from the<br />
Dy 3+ ion larger than 15 Å, many of them with intensities close to the noise level. Part of the 1 H line<br />
broadening is caused by unresolved RDCs, including intra-methyl RDCs (Kaikkonen et al., 2001),<br />
originating from the paramagnetically induced alignment of the protein with the magnetic field.<br />
In the cz- 186/ /Yb 3+ complex, the cutoff distance is reduced to about 9 Å due to the about<br />
6 times smaller paramagnetic moment of Yb 3+ so that only 10 methyl peaks are expected to be<br />
broadened beyond detection. Of the remaining 115 methyl resonances (red peaks in Figure 2.3b),<br />
only 14 peaks could not be analyzed due to overlap or very small PCS at larger distances from the<br />
metal ion. Figure 2.3 shows that for both paramagnetic lanthanides, it is nearly impossible to trace<br />
the paramagnetic shift of a 13 C-HSQC peak using the criterion that the PCS in the 13 C and 1 H<br />
dimensions of the spectrum must be similar. (In methyl groups, the distance between the carbon<br />
and the average position of the three protons is less than 0.4 Å.) Therefore, without prior<br />
knowledge of resonance assignments, PCS measurements cannot be made manually from 13 C-<br />
HSQC spectra alone.