Thesis Title: Subtitle - NMR Spectroscopy Research Group
Thesis Title: Subtitle - NMR Spectroscopy Research Group
Thesis Title: Subtitle - NMR Spectroscopy Research Group

Create successful ePaper yourself
Turn your PDF publications into a flip-book with our unique Google optimized e-Paper software.
126 Chapter 4. Protein Structure Determination from Pseudocontact Shifts using ROSETTA.<br />
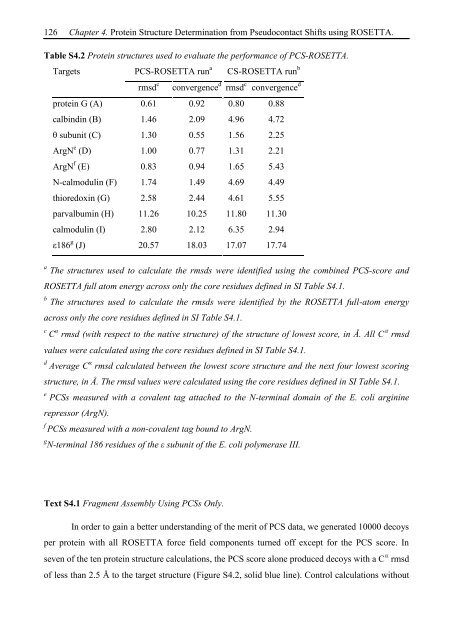
Table S4.2 Protein structures used to evaluate the performance of PCS-ROSETTA.<br />
Targets PCS-ROSETTA run a CS-ROSETTA run b<br />
rmsd c convergence d rmsd c convergence d<br />
protein G (A) 0.61 0.92 0.80 0.88<br />
calbindin (B) 1.46 2.09 4.96 4.72<br />
θ subunit (C) 1.30 0.55 1.56 2.25<br />
ArgN e (D) 1.00 0.77 1.31 2.21<br />
ArgN f (E) 0.83 0.94 1.65 5.43<br />
N-calmodulin (F) 1.74 1.49 4.69 4.49<br />
thioredoxin (G) 2.58 2.44 4.61 5.55<br />
parvalbumin (H) 11.26 10.25 11.80 11.30<br />
calmodulin (I) 2.80 2.12 6.35 2.94<br />
ε186 g (J) 20.57 18.03 17.07 17.74<br />
a The structures used to calculate the rmsds were identified using the combined PCS-score and<br />
ROSETTA full atom energy across only the core residues defined in SI Table S4.1.<br />
b The structures used to calculate the rmsds were identified by the ROSETTA full-atom energy<br />
across only the core residues defined in SI Table S4.1.<br />
c C α rmsd (with respect to the native structure) of the structure of lowest score, in Å. All C rmsd<br />
values were calculated using the core residues defined in SI Table S4.1.<br />
d Average C α rmsd calculated between the lowest score structure and the next four lowest scoring<br />
structure, in Å. The rmsd values were calculated using the core residues defined in SI Table S4.1.<br />
e PCSs measured with a covalent tag attached to the N-terminal domain of the E. coli arginine<br />
repressor (ArgN).<br />
f PCSs measured with a non-covalent tag bound to ArgN.<br />
g N-terminal 186 residues of the ε subunit of the E. coli polymerase III.<br />
Text S4.1 Fragment Assembly Using PCSs Only.<br />
In order to gain a better understanding of the merit of PCS data, we generated 10000 decoys<br />
per protein with all ROSETTA force field components turned off except for the PCS score. In<br />
seven of the ten protein structure calculations, the PCS score alone produced decoys with a C rmsd<br />
of less than 2.5 Å to the target structure (Figure S4.2, solid blue line). Control calculations without