Appendices 5-13 - Nautilus Cares - Nautilus Minerals
Appendices 5-13 - Nautilus Cares - Nautilus Minerals
Appendices 5-13 - Nautilus Cares - Nautilus Minerals
Create successful ePaper yourself
Turn your PDF publications into a flip-book with our unique Google optimized e-Paper software.
3.3 Affected areas and extents<br />
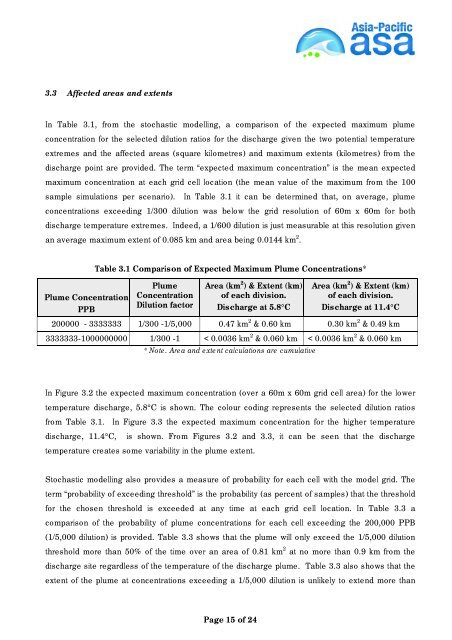
In Table 3.1, from the stochastic modelling, a comparison of the expected maximum plume<br />
concentration for the selected dilution ratios for the discharge given the two potential temperature<br />
extremes and the affected areas (square kilometres) and maximum extents (kilometres) from the<br />
discharge point are provided. The term “expected maximum concentration” is the mean expected<br />
maximum concentration at each grid cell location (the mean value of the maximum from the 100<br />
sample simulations per scenario). In Table 3.1 it can be determined that, on average, plume<br />
concentrations exceeding 1/300 dilution was below the grid resolution of 60m x 60m for both<br />
discharge temperature extremes. Indeed, a 1/600 dilution is just measurable at this resolution given<br />
an average maximum extent of 0.085 km and area being 0.0144 km 2 .<br />
Plume Concentration<br />
PPB<br />
Table 3.1 Comparison of Expected Maximum Plume Concentrations*<br />
Plume<br />
Concentration<br />
Dilution factor<br />
Area (km 2 ) & Extent (km)<br />
of each division.<br />
Discharge at 5.8°C<br />
Page 15 of 24<br />
Area (km 2 ) & Extent (km)<br />
of each division.<br />
Discharge at 11.4°C<br />
200000 - 3333333 1/300 -1/5,000 0.47 km 2 & 0.60 km 0.30 km 2 & 0.49 km<br />
3333333-1000000000 1/300 -1 < 0.0036 km 2 & 0.060 km < 0.0036 km 2 & 0.060 km<br />
* Note. Area and extent calculations are cumulative<br />
In Figure 3.2 the expected maximum concentration (over a 60m x 60m grid cell area) for the lower<br />
temperature discharge, 5.8°C is shown. The colour coding represents the selected dilution ratios<br />
from Table 3.1. In Figure 3.3 the expected maximum concentration for the higher temperature<br />
discharge, 11.4°C, is shown. From Figures 3.2 and 3.3, it can be seen that the discharge<br />
temperature creates some variability in the plume extent.<br />
Stochastic modelling also provides a measure of probability for each cell with the model grid. The<br />
term “probability of exceeding threshold” is the probability (as percent of samples) that the threshold<br />
for the chosen threshold is exceeded at any time at each grid cell location. In Table 3.3 a<br />
comparison of the probability of plume concentrations for each cell exceeding the 200,000 PPB<br />
(1/5,000 dilution) is provided. Table 3.3 shows that the plume will only exceed the 1/5,000 dilution<br />
threshold more than 50% of the time over an area of 0.81 km 2 at no more than 0.9 km from the<br />
discharge site regardless of the temperature of the discharge plume. Table 3.3 also shows that the<br />
extent of the plume at concentrations exceeding a 1/5,000 dilution is unlikely to extend more than


