

Appendices 5-13 - Nautilus Cares - Nautilus Minerals
Appendices 5-13 - Nautilus Cares - Nautilus Minerals
Appendices 5-13 - Nautilus Cares - Nautilus Minerals

Create successful ePaper yourself
Turn your PDF publications into a flip-book with our unique Google optimized e-Paper software.
5.0 km at any time during the discharge operation regardless of the temperature.<br />
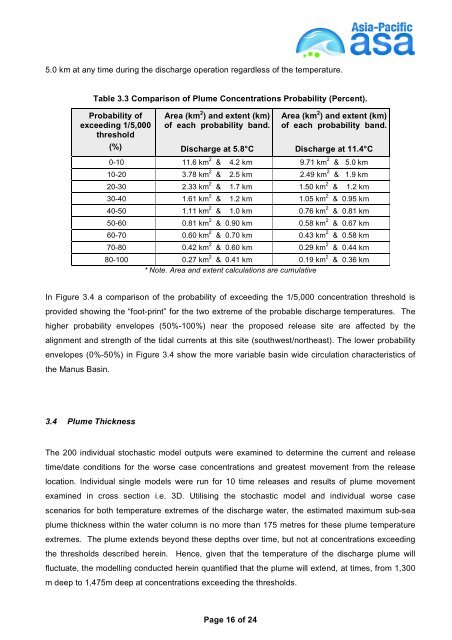
Table 3.3 Comparison of Plume Concentrations Probability (Percent).<br />
Probability of<br />
exceeding 1/5,000<br />
threshold<br />
(%)<br />
Area (km 2 ) and extent (km)<br />
of each probability band.<br />
Discharge at 5.8°C<br />
Page 16 of 24<br />
Area (km 2 ) and extent (km)<br />
of each probability band.<br />
Discharge at 11.4°C<br />
0-10 11.6 km 2 & 4.2 km 9.71 km 2 & 5.0 km<br />
10-20 3.78 km 2 & 2.5 km 2.49 km 2 & 1.9 km<br />
20-30 2.33 km 2 & 1.7 km 1.50 km 2 & 1.2 km<br />
30-40 1.61 km 2 & 1.2 km 1.05 km 2 & 0.95 km<br />
40-50 1.11 km 2 & 1.0 km 0.76 km 2 & 0.81 km<br />
50-60 0.81 km 2 & 0.90 km 0.58 km 2 & 0.67 km<br />
60-70 0.60 km 2 & 0.70 km 0.43 km 2 & 0.58 km<br />
70-80 0.42 km 2 & 0.60 km 0.29 km 2 & 0.44 km<br />
80-100 0.27 km 2 & 0.41 km 0.19 km 2 & 0.36 km<br />
* Note. Area and extent calculations are cumulative<br />
In Figure 3.4 a comparison of the probability of exceeding the 1/5,000 concentration threshold is<br />
provided showing the “foot-print” for the two extreme of the probable discharge temperatures. The<br />
higher probability envelopes (50%-100%) near the proposed release site are affected by the<br />
alignment and strength of the tidal currents at this site (southwest/northeast). The lower probability<br />
envelopes (0%-50%) in Figure 3.4 show the more variable basin wide circulation characteristics of<br />
the Manus Basin.<br />
3.4 Plume Thickness<br />
The 200 individual stochastic model outputs were examined to determine the current and release<br />
time/date conditions for the worse case concentrations and greatest movement from the release<br />
location. Individual single models were run for 10 time releases and results of plume movement<br />
examined in cross section i.e. 3D. Utilising the stochastic model and individual worse case<br />
scenarios for both temperature extremes of the discharge water, the estimated maximum sub-sea<br />
plume thickness within the water column is no more than 175 metres for these plume temperature<br />
extremes. The plume extends beyond these depths over time, but not at concentrations exceeding<br />
the thresholds described herein. Hence, given that the temperature of the discharge plume will<br />
fluctuate, the modelling conducted herein quantified that the plume will extend, at times, from 1,300<br />
m deep to 1,475m deep at concentrations exceeding the thresholds.