think-cell technical report TC2003/01 A GUI-based Interaction ...
think-cell technical report TC2003/01 A GUI-based Interaction ...
think-cell technical report TC2003/01 A GUI-based Interaction ...

Create successful ePaper yourself
Turn your PDF publications into a flip-book with our unique Google optimized e-Paper software.
6 Evaluation<br />
EVALUATION<br />
In this chapter I endeavor to evaluate the potential impact of the smart grid concept<br />
in general and of my implementation of a user interface in particular. First, I present<br />
an interpretation of the measurements taken in the field study (Chap. 2). This<br />
leads to an estimation of the over-all performance gain for the target user group.<br />
Subsequently, the actual performance of my prototype’s user interface is measured<br />
for a sample of real life slide layouts and is compared to the working speed of an<br />
expert using plain PowerPoint.<br />
6.1 Estimating the Potential Speed-Up<br />
Based on the four partitions of PowerPoint related activities (Sect. 2.2.1), it is<br />
assumed that there is no way to speed up text entry or custom drawings. On<br />
the other hand, my thesis claims that there is potential to significantly improve<br />
chart design and slide layout. In this section I estimate the potential speed-up for<br />
the latter activities and extrapolate the results to the entire PowerPoint-related<br />
workflow.<br />
6.1.1 Speedup for Chart Design<br />
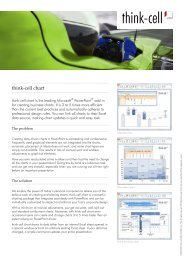
The <strong>think</strong>-<strong>cell</strong> add-in for efficient chart design was in beta state at the time of this<br />
writing. This software enhances PowerPoint with explicit support for frequently<br />
used chart types, which are not supported by Microsoft Graph. Furthermore, it also<br />
offers additional UI widgets for direct manipulation. Direct manipulation of charts,<br />
which allows user interaction with the graphical chart representation and feeds<br />
changes back into the data table, is not provided by Microsoft Graph. Although<br />
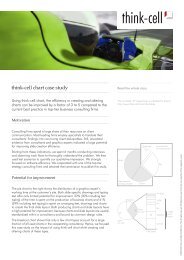
efficient chart design is not the focus of my thesis, it is an important aspect of<br />
PowerPoint usage in business consultancies and exemplifies the speed-up potential<br />
of carefully designed user interfaces for computer supported layout. A working<br />
prototype for waterfall charts served for a number of case studies that gave an<br />
impression of the possible performance gains.<br />
The results are impressive. A non-trivial chart that takes about 12 min to be<br />
created by an expert using plain PowerPoint, can be done in about 2 min with the<br />
<strong>think</strong>-<strong>cell</strong> chart add-in. This translates to a speed-up factor of 6 for the specific<br />
task.<br />
6.1.2 Speedup for Slide Layout<br />
I estimated the potential speed-up of the smart grid approach by simulating the<br />
necessary user interaction. The simulation was <strong>based</strong> on assumptions which sub-<br />
sume the smart grid concept from the user’s perspective: The user chooses which<br />
element to insert, describes the place in the smart grid where the element should<br />
go and in some cases specifies additional constraints.<br />
83