think-cell technical report TC2003/01 A GUI-based Interaction ...
think-cell technical report TC2003/01 A GUI-based Interaction ...
think-cell technical report TC2003/01 A GUI-based Interaction ...

Create successful ePaper yourself
Turn your PDF publications into a flip-book with our unique Google optimized e-Paper software.
6.2 Case Study EVALUATION<br />
Without specifying every detail of the user interaction at this point, I could<br />
deduce the approximate number of required mouse moves and clicks. For more<br />
plausible results, I distinguished easy mouse interactions (like selection of a single<br />
element) and difficult mouse interactions (like multiple paste) and assigned them<br />
2 seconds and 5 seconds time exposure, respectively. I did not take time for typing<br />
text into account, but I did account for entering the text entry mode with one easy<br />
interaction.<br />
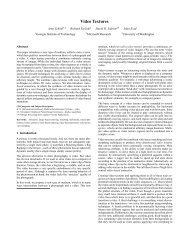
I applied this model to the slide that is shown in figure 9. The expert rating for<br />
creating the layout of that slide was 15 minutes. Based on my simulation model,<br />
using the smart grid and the solver, the layout could be specified in less than three<br />
minutes. This translates to a speed-up factor of 5 which compares well to the factor<br />
of 6 that was observed for chart design (Sect. 6.1.1).<br />
6.1.3 Expected Over-All Speed-Up<br />
Based on the findings presented in section 2.2.3, I projected my speed-up estimation<br />
on chart design and slide layout to the over-all PowerPoint-related workflow in a<br />
business consultancy. For the sake of the argument and to account for the fact<br />
that my case studies are not statistically representative, I did not take the speed-up<br />
factors of 6 and 5, but rounded off the estimated speed-up to 10<br />
3 . Figure 47 shows<br />
the result: In the chosen setting of a business consultancy, a performance gain of<br />
about 40 % can be expected for PowerPoint with the <strong>think</strong>-<strong>cell</strong> add-in in comparison<br />
to the plain PowerPoint.<br />
Chart design<br />
19.9%<br />
Custom drawings<br />
11.1%<br />
Text entry at<br />
160 chars/min<br />
29.7%<br />
Slide layout<br />
39.3%<br />
(a) Current time exposure (comp. Fig. 5(b))<br />
Time savings<br />
41.5%<br />
Custom drawings<br />
11.1%<br />
Text entry<br />
29.7%<br />
Chart design<br />
6.0%<br />
(b) Expected time savings<br />
Slide layout<br />
Figure 47: The estimated time saved with <strong>think</strong>-<strong>cell</strong> chart and layout plugins over<br />
all stages of the PowerPoint-related workflow is greater than 40 %.<br />
6.2 Case Study<br />
To the running prototype as described in the previous sections, I added some triv-<br />
ial solver functionality that implements “optimal” layout by equidistant gridlines.<br />
Hence, the prototype is already manoeuvrable and can serve as an evaluation of<br />
the user interface, however the output is far from esthetically satisfying. The un-<br />
derlying assumption is, of course, that with a real numerical solver the resulting<br />
layout would appear natural and appealing. In this section, a simple case study is<br />
84<br />
11.8%