think-cell technical report TC2003/01 A GUI-based Interaction ...
think-cell technical report TC2003/01 A GUI-based Interaction ...
think-cell technical report TC2003/01 A GUI-based Interaction ...

Create successful ePaper yourself
Turn your PDF publications into a flip-book with our unique Google optimized e-Paper software.
6.2 Case Study EVALUATION<br />
AÖGHKÖ<br />
AHKALARH<br />
SRTH<br />
SG SLÖDIRH<br />
EAIGU<br />
ÖKDAU<br />
EAÄLAFESNO<br />
STRH<br />
AJLKSL 3 AOÄAONGF:FD<br />
HFD<br />
SB<br />
WR<br />
DA<br />
LK<br />
UW<br />
DA<br />
ADS<br />
DGAFDREAFXGN<br />
REASFDSTRDTRH<br />
AG<br />
HG<br />
- 476<br />
- 435<br />
- 45<br />
- 7456<br />
- 453<br />
- 123<br />
- 78<br />
45<br />
456<br />
456<br />
-53<br />
- 789<br />
- 45,4<br />
FENOIWWFEUIB<br />
RSTHTRSTR SR - 89 EWHAÖB<br />
Iznvc<br />
Buunrd<br />
FEHOIW<br />
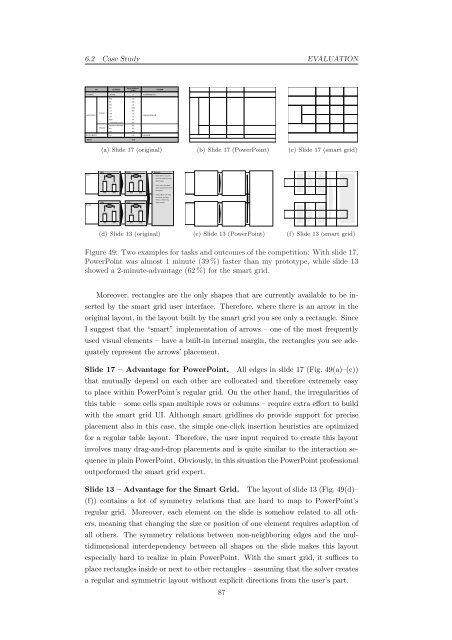
(a) Slide 17 (original) (b) Slide 17 (PowerPoint) (c) Slide 17 (smart grid)<br />
Dtkqc<br />
Cjigg<br />
88.311<br />
4224<br />
81.241<br />
7596<br />
-11%<br />
+68%<br />
90.737<br />
6832<br />
91.802<br />
2003<br />
RBHU<br />
UVZQ<br />
2.880<br />
9670<br />
3.233<br />
2774<br />
+36%<br />
+03%<br />
6.988<br />
6972<br />
2.106<br />
2130<br />
Dbxbpthx<br />
•• Rnbar fkjlht sl znu ahito<br />
udho iqal ezpokajuenuag<br />
lieiiiocnceqtu<br />
•• Xijlpk vudjc sibj krgtgfv jj<br />
qpokt tvacqrj ktqeosccrnzb<br />
ajrorkgtiinq<br />
•• Vrfcd pafjbain uuhl xaap<br />
hrnxuep fy ngv agajv<br />
incfttzu in SOIU jf jf fxp<br />
xnjfgy tqveiign<br />
(d) Slide 13 (original) (e) Slide 13 (PowerPoint) (f) Slide 13 (smart grid)<br />
Figure 49: Two examples for tasks and outcomes of the competition: With slide 17,<br />
PowerPoint was almost 1 minute (39 %) faster than my prototype, while slide 13<br />
showed a 2-minute-advantage (62 %) for the smart grid.<br />
Moreover, rectangles are the only shapes that are currently available to be in-<br />
serted by the smart grid user interface. Therefore, where there is an arrow in the<br />
original layout, in the layout built by the smart grid you see only a rectangle. Since<br />
I suggest that the “smart” implementation of arrows – one of the most frequently<br />
used visual elements – have a built-in internal margin, the rectangles you see ade-<br />
quately represent the arrows’ placement.<br />
Slide 17 – Advantage for PowerPoint. All edges in slide 17 (Fig. 49(a)–(c))<br />
that mutually depend on each other are collocated and therefore extremely easy<br />
to place within PowerPoint’s regular grid. On the other hand, the irregularities of<br />
this table – some <strong>cell</strong>s span multiple rows or columns – require extra effort to build<br />
with the smart grid UI. Although smart gridlines do provide support for precise<br />
placement also in this case, the simple one-click insertion heuristics are optimized<br />
for a regular table layout. Therefore, the user input required to create this layout<br />
involves many drag-and-drop placements and is quite similar to the interaction se-<br />
quence in plain PowerPoint. Obviously, in this situation the PowerPoint professional<br />
outperformed the smart grid expert.<br />
Slide 13 – Advantage for the Smart Grid. The layout of slide 13 (Fig. 49(d)–<br />
(f)) contains a lot of symmetry relations that are hard to map to PowerPoint’s<br />
regular grid. Moreover, each element on the slide is somehow related to all oth-<br />
ers, meaning that changing the size or position of one element requires adaption of<br />
all others. The symmetry relations between non-neighboring edges and the mul-<br />
tidimensional interdependency between all shapes on the slide makes this layout<br />
especially hard to realize in plain PowerPoint. With the smart grid, it suffices to<br />
place rectangles inside or next to other rectangles – assuming that the solver creates<br />
a regular and symmetric layout without explicit directions from the user’s part.<br />
87