Queensland Life Sciences Industry Report 2012 (PDF, 3.5MB)
Queensland Life Sciences Industry Report 2012 (PDF, 3.5MB)
Queensland Life Sciences Industry Report 2012 (PDF, 3.5MB)

Create successful ePaper yourself
Turn your PDF publications into a flip-book with our unique Google optimized e-Paper software.
5.2 Total Estimated <strong>Life</strong> <strong>Sciences</strong> <strong>Industry</strong> Employment<br />
Based on the average employment per organisation across all<br />
respondents, it was estimated that 14,106 FTEs were employed<br />
by the 301 <strong>Life</strong> <strong>Sciences</strong> companies, universities and research<br />
organisations across the State in 2011. Of those, 8021 were<br />
assumed to be in the Biotechnology sector and 6086 in TMD. The<br />
majority of Biotechnology employees (73%) were assumed to be<br />
employed by research organisations, and almost all employees in<br />
the TMD sector (96%) were assumed to be employed by companies<br />
(Table 20).<br />
TABLE 20: Estimated <strong>Queensland</strong>-wide <strong>Life</strong> <strong>Sciences</strong> <strong>Industry</strong><br />
employment 2011<br />
Companies Research<br />
Organisations<br />
Total<br />
Total <strong>Life</strong> <strong>Sciences</strong> <strong>Industry</strong> 8008 6098 14,106<br />
Biotechnology sector only 2150 5871 8021<br />
TMD sector only 5859 227 6086<br />
Numbers may appear inconsistent due to rounding.<br />
<strong>Queensland</strong>-wide employment estimates were 28.5% lower in<br />
2011 than those in 2009 (Table 21). The majority of employees<br />
were estimated to have been lost from companies. Research<br />
organisations were estimated to have a similar number of FTEs<br />
in 2009 and 2011.<br />
TABLE 21: Estimated <strong>Queensland</strong>-wide <strong>Life</strong> <strong>Sciences</strong> <strong>Industry</strong><br />
employment 2005-2011 12<br />
2005* 2007 2009 2011 Change 2009-<br />
2011<br />
All QLS Organisations<br />
Biotechnology<br />
ND 15,569 19,731 14,106 -28.5%<br />
All respondents 5215 7630 9929 8021 -19.3%<br />
Companies 1933 1840 3760 2150 -42.9%<br />
Research<br />
Organisations<br />
TMD<br />
3282 5790 6189 5871 -4.9%<br />
All respondents N/A 7939 9802 6086 -37.9%<br />
Companies N/A ND 9682 5859 -39.5%<br />
Research<br />
Organisations<br />
N/A ND 120 227 89.0%<br />
ND = not determined N/A = not applicable<br />
*Estimates from <strong>Queensland</strong> Biotechnology <strong>Industry</strong> – Benchmarking Study<br />
(2003–2005) Innovation Dynamics, Additional Data <strong>Report</strong>, April 2006. The<br />
basis for these estimates is unknown with only a limited description of the<br />
statistical methodology provided in the report, response rate for this question<br />
was not known but the overall response rate for the survey was 38%, with 32<br />
companies and 26 research institutes participating out of a database of 152.<br />
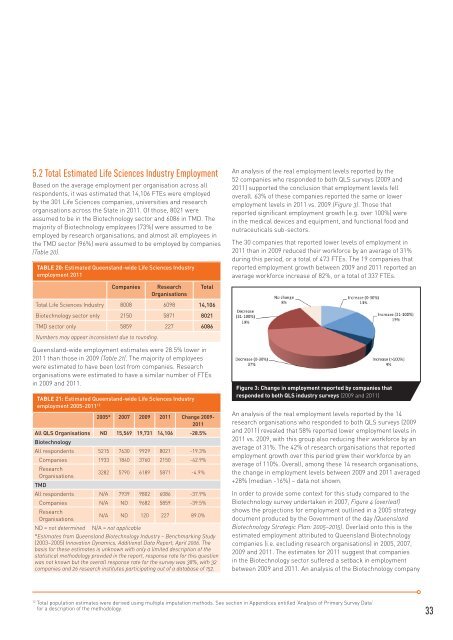
An analysis of the real employment levels reported by the<br />
52 companies who responded to both QLS surveys (2009 and<br />
2011) supported the conclusion that employment levels fell<br />
overall. 63% of these companies reported the same or lower<br />
employment levels in 2011 vs. 2009 (Figure 3). Those that<br />
reported significant employment growth (e.g. over 100%) were<br />
in the medical devices and equipment, and functional food and<br />
nutraceuticals sub-sectors.<br />
The 30 companies that reported lower levels of employment in<br />
2011 than in 2009 reduced their workforce by an average of 31%<br />
during this period, or a total of 473 FTEs. The 19 companies that<br />
reported employment growth between 2009 and 2011 reported an<br />
average workforce increase of 82%, or a total of 337 FTEs.<br />
Figure 3: Change in employment reported by companies that<br />
responded to both QLS industry surveys (2009 and 2011)<br />
An analysis of the real employment levels reported by the 14<br />
research organisations who responded to both QLS surveys (2009<br />
and 2011) revealed that 58% reported lower employment levels in<br />
2011 vs. 2009, with this group also reducing their workforce by an<br />
average of 31%. The 42% of research organisations that reported<br />
employment growth over this period grew their workforce by an<br />
average of 110%. Overall, among these 14 research organisations,<br />
the change in employment levels between 2009 and 2011 averaged<br />
+28% (median -16%) – data not shown.<br />
In order to provide some context for this study compared to the<br />
Biotechnology survey undertaken in 2007, Figure 4 (overleaf)<br />
shows the projections for employment outlined in a 2005 strategy<br />
document produced by the Government of the day (<strong>Queensland</strong><br />
Biotechnology Strategic Plan: 2005–2015). Overlaid onto this is the<br />
estimated employment attributed to <strong>Queensland</strong> Biotechnology<br />
companies (i.e. excluding research organisations) in 2005, 2007,<br />
2009 and 2011. The estimates for 2011 suggest that companies<br />
in the Biotechnology sector suffered a setback in employment<br />
between 2009 and 2011. An analysis of the Biotechnology company<br />
12 Total population estimates were derived using multiple imputation methods. See section in Appendices entitled ‘Analysis of Primary Survey Data’<br />
for a description of the methodology.<br />
33