Queensland Life Sciences Industry Report 2012 (PDF, 3.5MB)
Queensland Life Sciences Industry Report 2012 (PDF, 3.5MB)
Queensland Life Sciences Industry Report 2012 (PDF, 3.5MB)

You also want an ePaper? Increase the reach of your titles
YUMPU automatically turns print PDFs into web optimized ePapers that Google loves.
<strong>Queensland</strong> <strong>Life</strong> <strong>Sciences</strong> <strong>Industry</strong> <strong>Report</strong> <strong>2012</strong><br />
54<br />
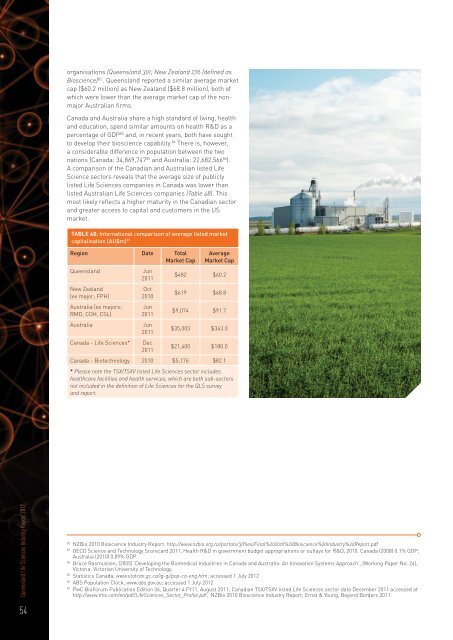
organisations (<strong>Queensland</strong> 301; New Zealand 276 (defined as<br />
Bioscience) 82 . <strong>Queensland</strong> reported a similar average market<br />
cap ($60.2 million) as New Zealand ($68.8 million), both of<br />
which were lower than the average market cap of the nonmajor<br />
Australian firms.<br />
Canada and Australia share a high standard of living, health<br />
and education, spend similar amounts on health R&D as a<br />
percentage of GDP 83 and, in recent years, both have sought<br />
to develop their bioscience capability. 84 There is, however,<br />
a considerable difference in population between the two<br />
nations (Canada: 34,869,747 85 and Australia: 22,682,566 86 ).<br />
A comparison of the Canadian and Australian listed <strong>Life</strong><br />
Science sectors reveals that the average size of publicly<br />
listed <strong>Life</strong> <strong>Sciences</strong> companies in Canada was lower than<br />
listed Australian <strong>Life</strong> <strong>Sciences</strong> companies (Table 48). This<br />
most likely reflects a higher maturity in the Canadian sector<br />
and greater access to capital and customers in the US<br />
market.<br />
TABLE 48: International comparison of average listed market<br />
capitalisation (AU$m) 87<br />
Region Date Total<br />
Market Cap<br />
<strong>Queensland</strong> Jun<br />
2011<br />
New Zealand<br />
(ex major; FPH)<br />
Australia (ex majors;<br />
RMD, COH, CSL)<br />
Oct<br />
2010<br />
Jun<br />
2011<br />
Average<br />
Market Cap<br />
$482 $60.2<br />
$619 $68.8<br />
$9,074 $91.7<br />
Australia Jun<br />
2011<br />
$35,003 $343.0<br />
Canada - <strong>Life</strong> <strong>Sciences</strong>* Dec<br />
2011<br />
$21,400 $180.0<br />
Canada - Biotechnology 2010 $5,176 $82.1<br />
* Please note the TSX/TSXV listed <strong>Life</strong> <strong>Sciences</strong> sector includes<br />
healthcare facilities and health services, which are both sub-sectors<br />
not included in the definition of <strong>Life</strong> <strong>Sciences</strong> for the QLS survey<br />
and report.<br />
82 NZBio 2010 Bioscience <strong>Industry</strong> <strong>Report</strong>. http://www.nzbio.org.nz/portals/3/files/Final%202010%20Bioscience%20<strong>Industry</strong>%20<strong>Report</strong>.pdf<br />
83 OECD Science and Technology Scorecard 2011, Health R&D in government budget appropriations or outlays for R&D, 2010. Canada (2008) 0.1% GDP;<br />
Australia (2010) 0.09% GDP.<br />
84 Bruce Rasmussen, (2005) ‘Developing the Biomedical Industries in Canada and Australia: An Innovation Systems Approach’, (Working Paper No. 24),<br />
Victoria: Victorian University of Technology.<br />
85 Statistics Canada, www.statcan.gc.ca/ig-gi/pop-ca-eng.htm; accessed 1 July <strong>2012</strong><br />
86 ABS Population Clock, www.abs.gov.au; accessed 1 July <strong>2012</strong><br />
87 PwC BioForum Publication Edition 36, Quarter 4 FY11, August 2011; Canadian TSX/TSXV listed <strong>Life</strong> <strong>Sciences</strong> sector data December 2011 accessed at<br />
http://www.tmx.com/en/pdf/<strong>Life</strong><strong>Sciences</strong>_Sector_Profile.pdf; NZBio 2010 Bioscience <strong>Industry</strong> <strong>Report</strong>; Ernst & Young, Beyond Borders 2011.