Queensland Life Sciences Industry Report 2012 (PDF, 3.5MB)
Queensland Life Sciences Industry Report 2012 (PDF, 3.5MB)
Queensland Life Sciences Industry Report 2012 (PDF, 3.5MB)

You also want an ePaper? Increase the reach of your titles
YUMPU automatically turns print PDFs into web optimized ePapers that Google loves.
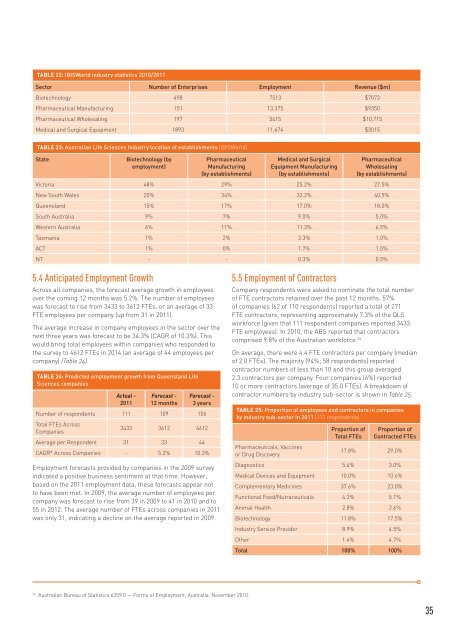
TABLE 22: IBISWorld industry statistics 2010/2011<br />
Sector Number of Enterprises Employment Revenue ($m)<br />
Biotechnology 498 7513 $7073<br />
Pharmaceutical Manufacturing 151 13,375 $9350<br />
Pharmaceutical Wholesaling 197 5415 $10,715<br />
Medical and Surgical Equipment 1893 11,674 $3015<br />
TABLE 23: Australian <strong>Life</strong> <strong>Sciences</strong> <strong>Industry</strong> location of establishments (IBISWorld)<br />
State Biotechnology (by<br />
employment)<br />
5.4 Anticipated Employment Growth<br />
Across all companies, the forecast average growth in employees<br />
over the coming 12 months was 5.2%. The number of employees<br />
was forecast to rise from 3433 to 3612 FTEs, or an average of 33<br />
FTE employees per company (up from 31 in 2011).<br />
The average increase in company employees in the sector over the<br />
next three years was forecast to be 34.3% (CAGR of 10.3%). This<br />
would bring total employees within companies who responded to<br />
the survey to 4612 FTEs in 2014 (an average of 44 employees per<br />
company) (Table 24).<br />
TABLE 24: Predicted employment growth from <strong>Queensland</strong> <strong>Life</strong><br />
<strong>Sciences</strong> companies<br />
Actual -<br />
2011<br />
Forecast -<br />
12 months<br />
Forecast -<br />
3 years<br />
Number of respondents 111 109 106<br />
Total FTEs Across<br />
Companies<br />
3433 3612 4612<br />
Average per Respondent 31 33 44<br />
CAGR* Across Companies - 5.2% 10.3%<br />
Employment forecasts provided by companies in the 2009 survey<br />
indicated a positive business sentiment at that time. However,<br />
based on the 2011 employment data, these forecasts appear not<br />
to have been met. In 2009, the average number of employees per<br />
company was forecast to rise from 39 in 2009 to 41 in 2010 and to<br />
55 in <strong>2012</strong>. The average number of FTEs across companies in 2011<br />
was only 31, indicating a decline on the average reported in 2009.<br />
Pharmaceutical<br />
Manufacturing<br />
(by establishments)<br />
Medical and Surgical<br />
Equipment Manufacturing<br />
(by establishments)<br />
5.5 Employment of Contractors<br />
Company respondents were asked to nominate the total number<br />
of FTE contractors retained over the past 12 months. 57%<br />
of companies (62 of 110 respondents) reported a total of 271<br />
FTE contractors, representing approximately 7.3% of the QLS<br />
workforce (given that 111 respondent companies reported 3433<br />
FTE employees). In 2010, the ABS reported that contractors<br />
comprised 9.8% of the Australian workforce. 24<br />
On average, there were 4.4 FTE contractors per company (median<br />
of 2.0 FTEs). The majority (94%; 58 respondents) reported<br />
contractor numbers of less than 10 and this group averaged<br />
2.3 contractors per company. Four companies (6%) reported<br />
10 or more contractors (average of 35.0 FTEs). A breakdown of<br />
contractor numbers by industry sub-sector is shown in Table 25.<br />
TABLE 25: Proportion of employees and contractors in companies<br />
by industry sub-sector in 2011 (111 respondents)<br />
Proportion of<br />
Total FTEs<br />
Pharmaceutical<br />
Wholesaling<br />
(by establishments)<br />
Victoria 48% 29% 25.2% 27.5%<br />
New South Wales 20% 34% 32.2% 40.5%<br />
<strong>Queensland</strong> 15% 17% 17.0% 18.0%<br />
South Australia 9% 7% 9.0% 5.0%<br />
Western Australia 6% 11% 11.3% 6.5%<br />
Tasmania 1% 2% 3.3% 1.0%<br />
ACT 1% 0% 1.7% 1.0%<br />
NT - - 0.3% 0.5%<br />
24 Australian Bureau of Statistics 6359.0 — Forms of Employment, Australia, November 2010.<br />
Proportion of<br />
Contracted FTEs<br />
Pharmaceuticals, Vaccines<br />
or Drug Discovery<br />
17.8% 29.0%<br />
Diagnostics 5.4% 3.0%<br />
Medical Devices and Equipment 10.0% 10.6%<br />
Complementary Medicines 37.6% 23.0%<br />
Functional Food/Nutraceuticals 4.3% 5.1%<br />
Animal Health 2.8% 2.6%<br />
Biotechnology 11.8% 17.5%<br />
<strong>Industry</strong> Service Provider 8.9% 4.5%<br />
Other 1.4% 4.7%<br />
Total 100% 100%<br />
35