Queensland Life Sciences Industry Report 2012 (PDF, 3.5MB)
Queensland Life Sciences Industry Report 2012 (PDF, 3.5MB)
Queensland Life Sciences Industry Report 2012 (PDF, 3.5MB)

Create successful ePaper yourself
Turn your PDF publications into a flip-book with our unique Google optimized e-Paper software.
10.2 Finance<br />
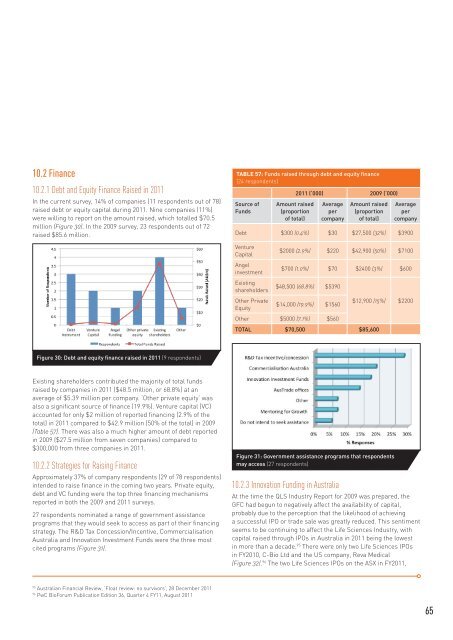
10.2.1 Debt and Equity Finance Raised in 2011<br />
In the current survey, 14% of companies (11 respondents out of 78)<br />
raised debt or equity capital during 2011. Nine companies (11%)<br />
were willing to report on the amount raised, which totalled $70.5<br />
million (Figure 30). In the 2009 survey, 23 respondents out of 72<br />
raised $85.6 million.<br />
Figure 30: Debt and equity finance raised in 2011 (9 respondents)<br />
Existing shareholders contributed the majority of total funds<br />
raised by companies in 2011 ($48.5 million, or 68.8%) at an<br />
average of $5.39 million per company. ‘Other private equity’ was<br />
also a significant source of finance (19.9%). Venture capital (VC)<br />
accounted for only $2 million of reported financing (2.9% of the<br />
total) in 2011 compared to $42.9 million (50% of the total) in 2009<br />
(Table 57). There was also a much higher amount of debt reported<br />
in 2009 ($27.5 million from seven companies) compared to<br />
$300,000 from three companies in 2011.<br />
10.2.2 Strategies for Raising Finance<br />
Approximately 37% of company respondents (29 of 78 respondents)<br />
intended to raise finance in the coming two years. Private equity,<br />
debt and VC funding were the top three financing mechanisms<br />
reported in both the 2009 and 2011 surveys.<br />
27 respondents nominated a range of government assistance<br />
programs that they would seek to access as part of their financing<br />
strategy. The R&D Tax Concession/Incentive, Commercialisation<br />
Australia and Innovation Investment Funds were the three most<br />
cited programs (Figure 31).<br />
95 Australian Financial Review, ‘Float review: no survivors’, 28 December 2011<br />
96 PwC BioForum Publication Edition 36, Quarter 4 FY11, August 2011<br />
TABLE 57: Funds raised through debt and equity finance<br />
(24 respondents)<br />
Source of<br />
Funds<br />
Amount raised<br />
(proportion<br />
of total)<br />
2011 (‘000) 2009 (‘000)<br />
Average<br />
per<br />
company<br />
Amount raised<br />
(proportion<br />
of total)<br />
Average<br />
per<br />
company<br />
Debt $300 (0.4%) $30 $27,500 (32%) $3900<br />
Venture<br />
Capital<br />
Angel<br />
investment<br />
Existing<br />
shareholders<br />
$2000 (2.9%) $220 $42,900 (50%) $7100<br />
$700 (1.0%) $70 $2400 (3%) $600<br />
$48,500 (68.8%) $5390<br />
Other Private<br />
Equity<br />
$14,000 (19.9%) $1560<br />
$12,900 (15%) $2200<br />
Other $5000 (7.1%) $560<br />
TOTAL $70,500 $85,600<br />
Figure 31: Government assistance programs that respondents<br />
may access (27 respondents)<br />
10.2.3 Innovation Funding in Australia<br />
At the time the QLS <strong>Industry</strong> <strong>Report</strong> for 2009 was prepared, the<br />
GFC had begun to negatively affect the availability of capital,<br />
probably due to the perception that the likelihood of achieving<br />
a successful IPO or trade sale was greatly reduced. This sentiment<br />
seems to be continuing to affect the <strong>Life</strong> <strong>Sciences</strong> <strong>Industry</strong>, with<br />
capital raised through IPOs in Australia in 2011 being the lowest<br />
in more than a decade. 95 There were only two <strong>Life</strong> <strong>Sciences</strong> IPOs<br />
in FY2010, C-Bio Ltd and the US company, Reva Medical<br />
(Figure 32). 96 The two <strong>Life</strong> <strong>Sciences</strong> IPOs on the ASX in FY2011,<br />
65