Queensland Life Sciences Industry Report 2012 (PDF, 3.5MB)
Queensland Life Sciences Industry Report 2012 (PDF, 3.5MB)
Queensland Life Sciences Industry Report 2012 (PDF, 3.5MB)

Create successful ePaper yourself
Turn your PDF publications into a flip-book with our unique Google optimized e-Paper software.
<strong>Queensland</strong> <strong>Life</strong> <strong>Sciences</strong> <strong>Industry</strong> <strong>Report</strong> <strong>2012</strong><br />
44<br />
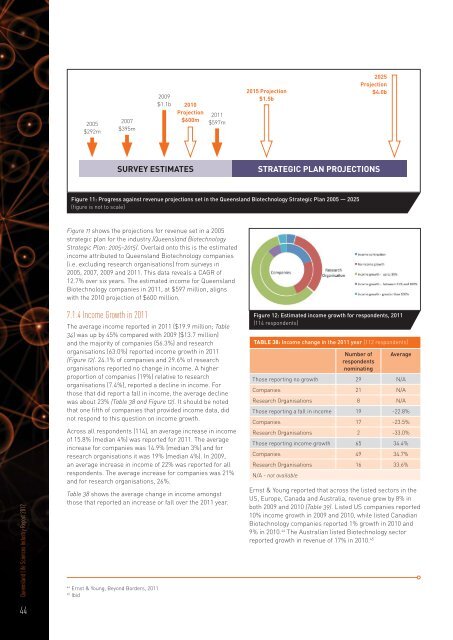
Figure 11 shows the projections for revenue set in a 2005<br />
strategic plan for the industry (<strong>Queensland</strong> Biotechnology<br />
Strategic Plan: 2005–2015). Overlaid onto this is the estimated<br />
income attributed to <strong>Queensland</strong> Biotechnology companies<br />
(i.e. excluding research organisations) from surveys in<br />
2005, 2007, 2009 and 2011. This data reveals a CAGR of<br />
12.7% over six years. The estimated income for <strong>Queensland</strong><br />
Biotechnology companies in 2011, at $597 million, aligns<br />
with the 2010 projection of $600 million.<br />
7.1.4 Income Growth in 2011<br />
The average income reported in 2011 ($19.9 million; Table<br />
34) was up by 45% compared with 2009 ($13.7 million)<br />
and the majority of companies (56.3%) and research<br />
organisations (63.0%) reported income growth in 2011<br />
(Figure 12). 24.1% of companies and 29.6% of research<br />
organisations reported no change in income. A higher<br />
proportion of companies (19%) relative to research<br />
organisations (7.4%), reported a decline in income. For<br />
those that did report a fall in income, the average decline<br />
was about 23% (Table 38 and Figure 12). It should be noted<br />
that one fifth of companies that provided income data, did<br />
not respond to this question on income growth.<br />
Across all respondents (114), an average increase in income<br />
of 15.8% (median 4%) was reported for 2011. The average<br />
increase for companies was 14.9% (median 3%) and for<br />
research organisations it was 19% (median 4%). In 2009,<br />
an average increase in income of 22% was reported for all<br />
respondents. The average increase for companies was 21%<br />
and for research organisations, 26%.<br />
Table 38 shows the average change in income amongst<br />
those that reported an increase or fall over the 2011 year.<br />
44 Ernst & Young, Beyond Borders, 2011<br />
45 Ibid<br />
2005<br />
$292m<br />
2007<br />
$395m<br />
2009<br />
$1.1b 2010<br />
Projection<br />
$600m<br />
2011<br />
$597m<br />
2015 Projection<br />
$1.5b<br />
SURVEY ESTIMATES STRATEGIC PLAN PROJECTIONS<br />
Figure 11: Progress against revenue projections set in the <strong>Queensland</strong> Biotechnology Strategic Plan 2005 — 2025<br />
(figure is not to scale)<br />
2025<br />
Projection<br />
$4.0b<br />
Figure 12: Estimated income growth for respondents, 2011<br />
(114 respondents)<br />
TABLE 38: Income change in the 2011 year (112 respondents)<br />
Number of<br />
respondents<br />
nominating<br />
Average<br />
Those reporting no growth 29 N/A<br />
Companies 21 N/A<br />
Research Organisations 8 N/A<br />
Those reporting a fall in income 19 -22.8%<br />
Companies 17 -23.5%<br />
Research Organisations 2 -33.0%<br />
Those reporting income growth 65 34.4%<br />
Companies 49 34.7%<br />
Research Organisations<br />
N/A - not available<br />
16 33.6%<br />
Ernst & Young reported that across the listed sectors in the<br />
US, Europe, Canada and Australia, revenue grew by 8% in<br />
both 2009 and 2010 (Table 39). Listed US companies reported<br />
10% income growth in 2009 and 2010, while listed Canadian<br />
Biotechnology companies reported 1% growth in 2010 and<br />
9% in 2010. 44 The Australian listed Biotechnology sector<br />
reported growth in revenue of 17% in 2010. 45