Queensland Life Sciences Industry Report 2012 (PDF, 3.5MB)
Queensland Life Sciences Industry Report 2012 (PDF, 3.5MB)
Queensland Life Sciences Industry Report 2012 (PDF, 3.5MB)

Create successful ePaper yourself
Turn your PDF publications into a flip-book with our unique Google optimized e-Paper software.
considered ‘microcap’ — with a market cap of less than $50<br />
million. As at 30 June 2011, only three of eight companies were<br />
‘microcap’. All but one of the companies that were listed in both<br />
2009 and 2011 increased their market cap during this period<br />
(Table 47).<br />
TABLE 47: Market capitalisation of ASX-Listed <strong>Queensland</strong> <strong>Life</strong><br />
<strong>Sciences</strong> companies 78<br />
Company Code <strong>Life</strong> <strong>Sciences</strong><br />
Sub-sector<br />
Alchemia<br />
Limited<br />
ACL Pharma,<br />
vaccines or<br />
drug discovery<br />
Analytica Limited ALT Medical devices<br />
and equipment<br />
Anteo<br />
Diagnostics<br />
(previously<br />
Bio-Layer)<br />
BioProspect<br />
Limited<br />
ADO Pharma,<br />
vaccines or<br />
drug discovery<br />
CBio Limited CBZ Pharma,<br />
vaccines<br />
or drug<br />
discovery<br />
Impedimed<br />
Limited<br />
Progen<br />
Pharmaceuticals<br />
Ltd<br />
Market Cap ($m)<br />
2009* 2011 + Change<br />
$57.0 $117.0 105%<br />
$7.5 $12.3 64%<br />
$1.8 $53.4 2867%<br />
BPO Biotechnology $8.3 $8.9 8%<br />
IPD Medical devices<br />
and equipment<br />
PGL Pharma<br />
vaccines or<br />
drug discovery<br />
N/A $98.2 N/A<br />
$62.3 $89.2 43%<br />
$21.0 $5.7 -73%<br />
Tissue Therapies TIS Biotechnology $12.5 $97.0 676%<br />
* As at 30 June 2009 + As at 30 June, 2011<br />
8.3 Market Capitalisation — <strong>Queensland</strong>, Australia,<br />
New Zealand and Canada<br />
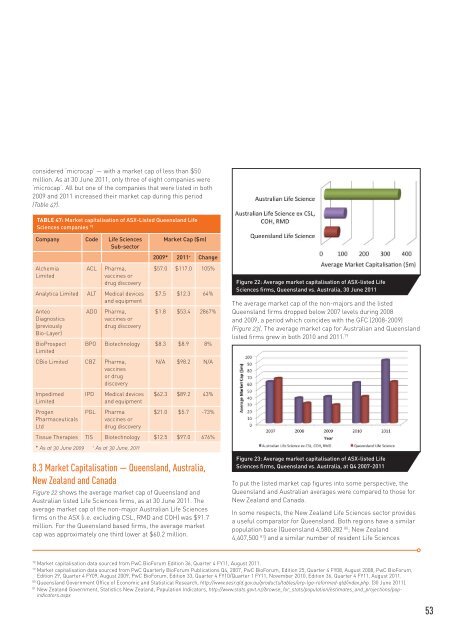
Figure 22 shows the average market cap of <strong>Queensland</strong> and<br />
Australian listed <strong>Life</strong> <strong>Sciences</strong> firms, as at 30 June 2011. The<br />
average market cap of the non-major Australian <strong>Life</strong> <strong>Sciences</strong><br />
firms on the ASX (i.e. excluding CSL, RMD and COH) was $91.7<br />
million. For the <strong>Queensland</strong> based firms, the average market<br />
cap was approximately one third lower at $60.2 million.<br />
Figure 22: Average market capitalisation of ASX-listed <strong>Life</strong><br />
<strong>Sciences</strong> firms, <strong>Queensland</strong> vs. Australia, 30 June 2011<br />
The average market cap of the non-majors and the listed<br />
<strong>Queensland</strong> firms dropped below 2007 levels during 2008<br />
and 2009, a period which coincides with the GFC (2008-2009)<br />
(Figure 23). The average market cap for Australian and <strong>Queensland</strong><br />
listed firms grew in both 2010 and 2011. 79<br />
Figure 23: Average market capitalisation of ASX-listed <strong>Life</strong><br />
<strong>Sciences</strong> firms, <strong>Queensland</strong> vs. Australia, at Q4 2007-2011<br />
To put the listed market cap figures into some perspective, the<br />
<strong>Queensland</strong> and Australian averages were compared to those for<br />
New Zealand and Canada.<br />
In some respects, the New Zealand <strong>Life</strong> <strong>Sciences</strong> sector provides<br />
a useful comparator for <strong>Queensland</strong>. Both regions have a similar<br />
population base (<strong>Queensland</strong> 4,580,282 80 ; New Zealand<br />
4,407,500 81 ) and a similar number of resident <strong>Life</strong> <strong>Sciences</strong><br />
78 Market capitalisation data sourced from PwC BioForum Edition 36, Quarter 4 FY11, August 2011.<br />
79 Market capitalisation data sourced from PwC Quarterly BioForum Publications Q4, 2007, PwC BioForum, Edition 25, Quarter 4 FY08, August 2008, PwC BioForum,<br />
Edition 29, Quarter 4 FY09, August 2009, PwC BioForum, Edition 33, Quarter 4 FY10/Quarter 1 FY11, November 2010, Edition 36, Quarter 4 FY11, August 2011.<br />
80 <strong>Queensland</strong> Government Office of Economic and Statistical Research, http://www.oesr.qld.gov.au/products/tables/erp-lga-reformed-qld/index.php. (30 June 2011).<br />
81 New Zealand Government, Statistics New Zealand, Population Indicators, http://www.stats.govt.nz/browse_for_stats/population/estimates_and_projections/popindicators.aspx<br />
53