Queensland Life Sciences Industry Report 2012 (PDF, 3.5MB)
Queensland Life Sciences Industry Report 2012 (PDF, 3.5MB)
Queensland Life Sciences Industry Report 2012 (PDF, 3.5MB)

Create successful ePaper yourself
Turn your PDF publications into a flip-book with our unique Google optimized e-Paper software.
Research organisations reported that, on average, 47.3% of their<br />
workforce held a PhD (median figure was 42.5%). A 2008 survey<br />
by the Australian Society for Medical Research generally supports<br />
these findings. In this survey, 39% of all staff, and 65% of research<br />
staff in medical research institutes and university departments<br />
were said to have held a PhD. 34<br />
The percentage of PhD qualified personnel reported by companies<br />
in the current survey varied considerably, but the overall average<br />
was 19% (median 4%). This is comparable with data from a<br />
pharmaceutical industry survey undertaken by Medicines Australia<br />
in 2009, which revealed that 5% of company staff held a PhD and<br />
14% held a Masters degree. 35 41% of companies reported no PhD<br />
qualified personnel, 19% reported that over half of their workforce<br />
was PhD qualified and 3.6% of companies reported that all of their<br />
staff had a PhD. Those with a high proportion of PhD qualified staff<br />
(›70%) were typically either small, start-up biopharmaceutical<br />
companies spun-out of <strong>Queensland</strong> research organisations or<br />
service providers/industry consultants.<br />
The Australian Council for Educational Research reported in 2008<br />
that private sector employers did not particularly value nor seek<br />
personnel qualified with research PhD or Masters degrees in<br />
the mathematics and science fields, and instead sought degree<br />
and honours graduates. 36 53.6% of persons employed in the ABS<br />
industry category of Professional, Technical and Scientific Services<br />
in 2010 were tertiary qualified, compared to 23.0% of the general<br />
population. 37 However, the typical level and type of qualification<br />
held by an employee will vary depending on the stage of company<br />
development. 38,39 Overall, tertiary qualifications in the Australian<br />
workforce are becoming more prevalent with 24% of workers (aged<br />
15-64) holding a degree in 2011 compared to 17% in 2001. 40<br />
6.4 Predicted Skill Gaps<br />
6.4.1 Skills Gaps — All Respondents<br />
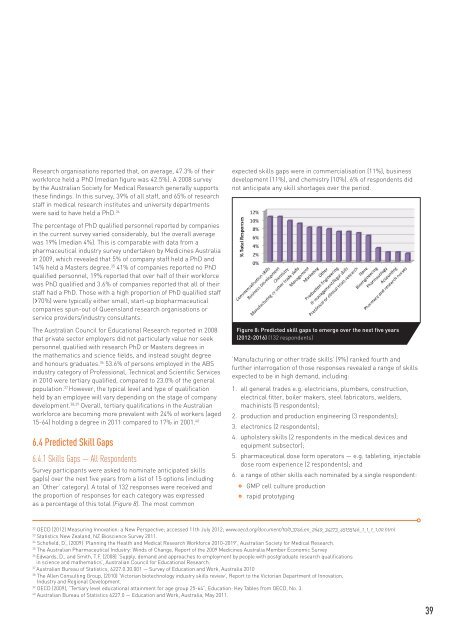
Survey participants were asked to nominate anticipated skills<br />
gap(s) over the next five years from a list of 15 options (including<br />
an ‘Other’ category). A total of 132 responses were received and<br />
the proportion of responses for each category was expressed<br />
as a percentage of this total (Figure 8). The most common<br />
expected skills gaps were in commercialisation (11%), business<br />
development (11%), and chemistry (10%). 6% of respondents did<br />
not anticipate any skill shortages over the period.<br />
Figure 8: Predicted skill gaps to emerge over the next five years<br />
(<strong>2012</strong>-2016) (132 respondents)<br />
‘Manufacturing or other trade skills’ (9%) ranked fourth and<br />
further interrogation of those responses revealed a range of skills<br />
expected to be in high demand, including:<br />
1. all general trades e.g. electricians, plumbers, construction,<br />
electrical fitter, boiler makers, steel fabricators, welders,<br />
machinists (5 respondents);<br />
2. production and production engineering (3 respondents);<br />
3. electronics (2 respondents);<br />
4. upholstery skills (2 respondents in the medical devices and<br />
equipment subsector);<br />
5. pharmaceutical dose form operators — e.g. tableting, injectable<br />
dose room experience (2 respondents); and<br />
6. a range of other skills each nominated by a single respondent:<br />
GMP cell culture production<br />
rapid prototyping<br />
32 OECD (<strong>2012</strong>) Measuring Innovation: a New Perspective; accessed 11th July <strong>2012</strong>; www.oecd.org/document/10/0,3746,en_2649_34273_45155146_1_1_1_1,00.html<br />
33 Statistics New Zealand, NZ Bioscience Survey 2011.<br />
34 Schofield, D., (2009) ‘Planning the Health and Medical Research Workforce 2010-2019’, Australian Society for Medical Research.<br />
35 The Australian Pharmaceutical <strong>Industry</strong>: Winds of Change, <strong>Report</strong> of the 2009 Medicines Australia Member Economic Survey<br />
36 Edwards, D., and Smith, T.F. (2008) ‘Supply, demand and approaches to employment by people with postgraduate research qualifications<br />
in science and mathematics’, Australian Council for Educational Research.<br />
37 Australian Bureau of Statistics, 6227.0.30.001 — Survey of Education and Work, Australia 2010<br />
38 The Allen Consulting Group, (2010) ‘Victorian biotechnology industry skills review’, <strong>Report</strong> to the Victorian Department of Innovation,<br />
<strong>Industry</strong> and Regional Development.<br />
39 OECD (2009), “Tertiary level educational attainment for age group 25-64”, Education: Key Tables from OECD, No. 3.<br />
40 Australian Bureau of Statistics 6227.0 — Education and Work, Australia, May 2011.<br />
39