Queensland Life Sciences Industry Report 2012 (PDF, 3.5MB)
Queensland Life Sciences Industry Report 2012 (PDF, 3.5MB)
Queensland Life Sciences Industry Report 2012 (PDF, 3.5MB)

You also want an ePaper? Increase the reach of your titles
YUMPU automatically turns print PDFs into web optimized ePapers that Google loves.
<strong>Queensland</strong> <strong>Life</strong> <strong>Sciences</strong> <strong>Industry</strong> <strong>Report</strong> <strong>2012</strong><br />
76<br />
12. EXPORTS AND INTERNATIONAL<br />
COLLABORATIONS<br />
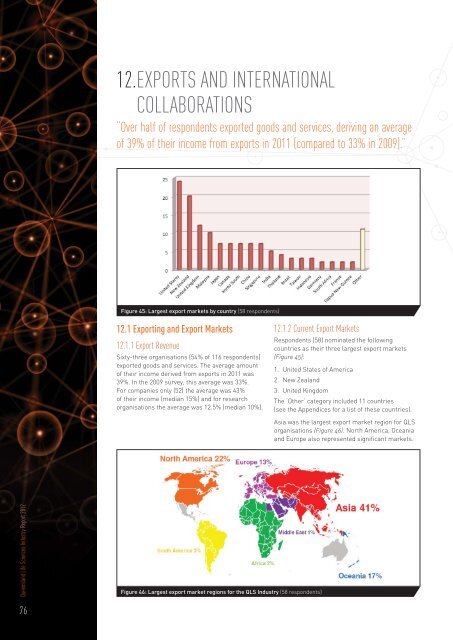
“Over half of respondents exported goods and services, deriving an average<br />
of 39% of their income from exports in 2011 (compared to 33% in 2009).”<br />
Figure 45: Largest export markets by country (58 respondents)<br />
12.1 Exporting and Export Markets<br />
12.1.1 Export Revenue<br />
Sixty-three organisations (54% of 116 respondents)<br />
exported goods and services. The average amount<br />
of their income derived from exports in 2011 was<br />
39%. In the 2009 survey, this average was 33%.<br />
For companies only (52) the average was 43%<br />
of their income (median 15%) and for research<br />
organisations the average was 12.5% (median 10%).<br />
12.1.2 Current Export Markets<br />
Figure 46: Largest export market regions for the QLS <strong>Industry</strong> (58 respondents)<br />
Respondents (58) nominated the following<br />
countries as their three largest export markets<br />
(Figure 45):<br />
1. United States of America<br />
2. New Zealand<br />
3. United Kingdom<br />
The ‘Other’ category included 11 countries<br />
(see the Appendices for a list of these countries).<br />
Asia was the largest export market region for QLS<br />
organisations (Figure 46). North America, Oceania<br />
and Europe also represented significant markets.