Psychology - Forgot your username
Psychology - Forgot your username
Psychology - Forgot your username

You also want an ePaper? Increase the reach of your titles
YUMPU automatically turns print PDFs into web optimized ePapers that Google loves.
Some advice from students on writing up projects<br />
case in <strong>your</strong> department. Generally, people are less fussy about following a particular<br />
style for figures and tables. The important thing is that they are well<br />
designed, accurate and clearly labelled, and the format is the same all the way<br />
through the report. It is worth giving some thought to this. The Results section is<br />
the centrepiece of <strong>your</strong> report and well-presented data will help to make it succinct,<br />
clear and professional in appearance. You should start by considering <strong>your</strong><br />
data and thinking which method will present them to best effect.<br />
Note: All the examples shown in this section are in APA format, but, as elsewhere, the data<br />
are invented to make the points more clearly.<br />
Tables<br />
RESEARCH PROJECTS AND DISSERTATIONS 147<br />
My supervisor wasn’t very sure of the best way to analyse my results, so I asked<br />
the guy who taught us statistics in the second year and he was incredibly helpful.<br />
A friend told me how to analyse my results, but he got it wrong. I wished I’d<br />
checked with my supervisor.<br />
I worked incredibly hard planning and running my project, and did it extremely<br />
well, but I didn’t leave enough time for analysing and writing it up. So the<br />
report, which is the main thing the examiners look at, was, I know, not very<br />
good. I only got a 2:1 when I hoped to get a first. So leave more time than you<br />
can possibly imagine to fiddle around working out the best way to present and<br />
analyse <strong>your</strong> data, and then to proof-read what you have written very carefully.<br />
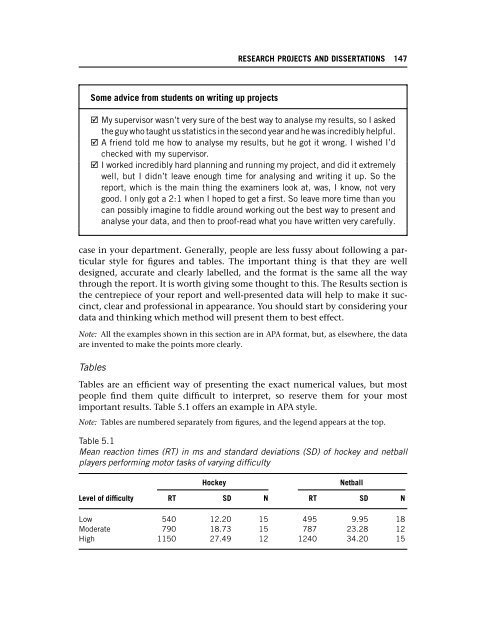
Tables are an efficient way of presenting the exact numerical values, but most<br />
people find them quite difficult to interpret, so reserve them for <strong>your</strong> most<br />
important results. Table 5.1 offers an example in APA style.<br />
Note: Tables are numbered separately from figures, and the legend appears at the top.<br />
Table 5.1<br />
Mean reaction times (RT) in ms and standard deviations (SD) of hockey and netball<br />
players performing motor tasks of varying difficulty<br />
Hockey Netball<br />
Level of difficulty RT SD N RT SD N<br />
Low 540 12.20 15 495 9.95 18<br />
Moderate 790 18.73 15 787 23.28 12<br />
High 1150 27.49 12 1240 34.20 15