PDF file - Laboratoire de Géologie de l'Ecole normale supérieure - Ens
PDF file - Laboratoire de Géologie de l'Ecole normale supérieure - Ens
PDF file - Laboratoire de Géologie de l'Ecole normale supérieure - Ens

Create successful ePaper yourself
Turn your PDF publications into a flip-book with our unique Google optimized e-Paper software.
X - 4 SIMONS ET AL.: GPS MEASUREMENTS IN S.E. ASIA TO REFINE SUNDALAND MOTION<br />
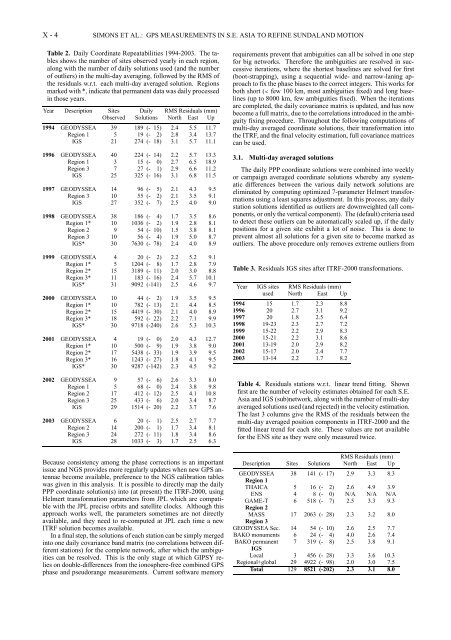
Table 2. Daily Coordinate Repeatabilities 1994-2003. The tables<br />
shows the number of sites observed yearly in each region,<br />
along with the number of daily solutions used (and the number<br />
of outliers) in the multi-day averaging, followed by the RMS of<br />
the residuals w.r.t. each multi-day averaged solution. Regions<br />
marked with *, indicate that permanent data was daily processed<br />
in those years.<br />
Year Description Sites Daily RMS Residuals (mm)<br />
Observed Solutions North East Up<br />
1994 GEODYSSEA 39 189 (- 15) 2.4 5.5 11.7<br />
Region 1 5 19 (- 2) 2.8 3.4 13.7<br />
IGS 21 274 (- 18) 3.1 5.7 11.1<br />
1996 GEODYSSEA 40 224 (- 14) 2.2 5.7 13.3<br />
Region 1 3 15 (- 0) 2.7 6.5 18.9<br />
Region 3 7 27 (- 1) 2.9 6.6 11.2<br />
IGS 25 325 (- 16) 3.1 6.8 11.5<br />
1997 GEODYSSEA 14 96 (- 5) 2.1 4.3 9.5<br />
Region 3 10 55 (- 2) 2.1 3.5 9.1<br />
IGS 27 352 (- 7) 2.5 4.0 9.0<br />
1998 GEODYSSEA 38 186 (- 4) 1.7 3.5 8.6<br />
Region 1* 10 1036 (- 2) 1.9 2.8 8.1<br />
Region 2 9 54 (- 10) 1.5 3.8 8.1<br />
Region 3 10 56 (- 4) 1.9 5.0 8.7<br />
IGS* 30 7630 (- 78) 2.4 4.0 8.9<br />
1999 GEODYSSEA 4 20 (- 2) 2.2 5.2 9.1<br />
Region 1* 5 1204 (- 8) 1.7 2.8 7.9<br />
Region 2* 15 3189 (- 11) 2.0 3.0 8.8<br />
Region 3* 11 183 (- 16) 2.4 5.7 10.1<br />
IGS* 31 9092 (-141) 2.5 4.6 9.7<br />
2000 GEODYSSEA 10 44 (- 2) 1.9 3.5 9.5<br />
Region 1* 10 782 (- 13) 2.1 4.4 8.5<br />
Region 2* 15 4419 (- 30) 2.1 4.0 8.9<br />
Region 3* 18 592 (- 22) 2.2 7.1 9.9<br />
IGS* 30 9718 (-240) 2.6 5.3 10.3<br />
2001 GEODYSSEA 4 19 (- 0) 2.0 4.3 12.7<br />
Region 1* 10 500 (- 9) 1.9 3.8 9.0<br />
Region 2* 17 5438 (- 33) 1.9 3.9 9.5<br />
Region 3* 16 1243 (- 27) 1.8 4.1 9.5<br />
IGS* 30 9287 (-142) 2.3 4.5 9.2<br />
2002 GEODYSSEA 9 57 (- 6) 2.6 3.3 8.0<br />
Region 1 5 68 (- 0) 2.4 3.8 9.8<br />
Region 2 17 412 (- 12) 2.5 4.1 10.8<br />
Region 3 25 433 (- 6) 2.0 3.4 8.7<br />
IGS 29 1514 (- 20) 2.2 3.7 7.6<br />
2003 GEODYSSEA 6 20 (- 1) 2.5 2.7 7.7<br />
Region 2 14 200 (- 1) 1.7 3.4 8.1<br />
Region 3 24 272 (- 11) 1.8 3.4 8.6<br />
IGS 28 1033 (- 3) 1.7 2.5 6.3<br />
Because consistency among the phase corrections is an important<br />
issue and NGS provi<strong>de</strong>s more regularly updates when new GPS antennae<br />
become available, preference to the NGS calibration tables<br />
was given in this analysis. It is possible to directly map the daily<br />
PPP coordinate solution(s) into (at present) the ITRF-2000, using<br />
Helmert transformation parameters from JPL which are compatible<br />
with the JPL precise orbits and satellite clocks. Although this<br />
approach works well, the parameters sometimes are not directly<br />
available, and they need to re-computed at JPL each time a new<br />
ITRF solution becomes available.<br />
In a final step, the solutions of each station can be simply merged<br />
into one daily covariance band matrix (no correlations between different<br />
stations) for the complete network, after which the ambiguities<br />
can be resolved. This is the only stage at which GIPSY relies<br />
on double-differences from the ionosphere-free combined GPS<br />
phase and pseudorange measurements. Current software memory<br />
requirements prevent that ambiguities can all be solved in one step<br />
for big networks. Therefore the ambiguities are resolved in successive<br />
iterations, where the shortest baselines are solved for first<br />
(boot-strapping), using a sequential wi<strong>de</strong>- and narrow-laning approach<br />
to fix the phase biases to the correct integers. This works for<br />
both short (< few 100 km, most ambiguities fixed) and long baselines<br />
(up to 8000 km, few ambiguities fixed). When the iterations<br />
are completed, the daily covariance matrix is updated, and has now<br />
become a full matrix, due to the correlations introduced in the ambiguity<br />
fixing procedure. Throughout the following computations of<br />
multi-day averaged coordinate solutions, their transformation into<br />
the ITRF, and the final velocity estimation, full covariance matrices<br />
can be used.<br />
3.1. Multi-day averaged solutions<br />
The daily PPP coordinate solutions were combined into weekly<br />
or campaign averaged coordinate solutions whereby any systematic<br />
differences between the various daily network solutions are<br />
eliminated by computing optimized 7-parameter Helmert transformations<br />
using a least squares adjustment. In this process, any daily<br />
station solutions i<strong>de</strong>ntified as outliers are downweighted (all components,<br />
or only the vertical component). The (<strong>de</strong>fault) criteria used<br />
to <strong>de</strong>tect these outliers can be automatically scaled up, if the daily<br />
positions for a given site exhibit a lot of noise. This is done to<br />
prevent almost all solutions for a given site to become marked as<br />
outliers. The above procedure only removes extreme outliers from<br />
Table 3. Residuals IGS sites after ITRF-2000 transformations.<br />
Year IGS sites RMS Residuals (mm)<br />
used North East Up<br />
1994 15 1.7 2.3 8.8<br />
1996 20 2.7 3.1 9.2<br />
1997 20 1.8 2.5 6.4<br />
1998 19-23 2.3 2.7 7.2<br />
1999 15-22 2.2 2.9 8.3<br />
2000 15-21 2.2 3.1 8.6<br />
2001 13-19 2.0 2.9 8.2<br />
2002 15-17 2.0 2.4 7.7<br />
2003 13-14 2.2 1.7 8.2<br />
Table 4. Residuals stations w.r.t. linear trend fitting. Shown<br />
first are the number of velocity estimates obtained for each S.E.<br />
Asia and IGS (sub)network, along with the number of multi-day<br />
averaged solutions used (and rejected) in the velocity estimation.<br />
The last 3 columns give the RMS of the residuals between the<br />
multi-day averaged position components in ITRF-2000 and the<br />
fitted linear trend for each site. These values are not available<br />
for the ENS site as they were only measured twice.<br />
RMS Residuals (mm)<br />
Description Sites Solutions North East Up<br />
GEODYSSEA 38 141 (- 17) 2.9 3.3 8.3<br />
Region 1<br />
THAICA 5 16 (- 2) 2.6 4.9 3.9<br />
ENS 4 8 (- 0) N/A N/A N/A<br />
GAME-T 6 518 (- 7) 2.5 3.3 9.3<br />
Region 2<br />
MASS 17 2063 (- 28) 2.3 3.2 8.0<br />
Region 3<br />
GEODYSSEA Sec. 14 54 (- 10) 2.6 2.5 7.7<br />
BAKO monuments 6 24 (- 4) 4.0 2.6 7.4<br />
BAKO permanent 7 319 (- 8) 2.5 3.8 9.1<br />
IGS<br />
Local 3 456 (- 28) 3.3 3.6 10.3<br />
Regional+global 29 4922 (- 98) 2.0 3.0 7.5<br />
Total 129 8521 (-202) 2.3 3.1 8.0