A Feasibility Study - Aaltodoc - Aalto-yliopisto
A Feasibility Study - Aaltodoc - Aalto-yliopisto
A Feasibility Study - Aaltodoc - Aalto-yliopisto

You also want an ePaper? Increase the reach of your titles
YUMPU automatically turns print PDFs into web optimized ePapers that Google loves.
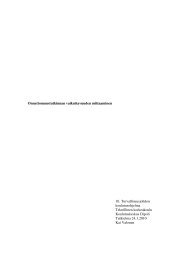
Cost of water (€/m³)<br />
5<br />
4,5<br />
4<br />
3,5<br />
3<br />
2,5<br />
2<br />
1,5<br />
1<br />
0,5<br />
0<br />
Figure 45. Cost of water (€/m³) on Site 2.<br />
At the nominal pump capacity of 0,03 m³/s, there are 8 pressure vessels and 56 RO<br />
membranes, with a nominal output of 1400 m³/day. The cost breakdown of Site 2 at a<br />
nominal pump capacity of 0,03 m³/s is presented in Table 7.<br />
9.6 Site 3<br />
Cost of Water (€/m3)<br />
Load factor (%)<br />
0<br />
0 0,05 0,1 0,15 0,2 0,25 0,3<br />
WaveRoller nominal pump capacity (m³/s)<br />
Table 7. Cost breakdown of Site 2 with a nominal pump capacity of 0,03 m³/s.<br />
Capital expenses (€) Operational expenses (€)<br />
WEC 1 800 000 90 000<br />
RO 450 000 30 000<br />
Total 2 250 000 120 000<br />
Annual 210 000 120 000<br />
Site 3 has a good wave climate, with an average wave power of 16 kW/m. The<br />
performance and retention curves of Site 3 have been given in the Appendix B. The<br />
calculation presented in this Chapter follows the calculation method described in<br />
Chapter 9.1. The average recovery rate in all the calculations on Site 3 has been 28,5 %<br />
and the average permeate TDS is 134 mg/l, which is well below the limit of 500 mg/l.<br />
The permeate production on Site 3 is basically constantly increasing. The permeate<br />
production is highest at 1685 m³/day at the end of the study range with a nominal pump<br />
capacity of 0,24 m³/s, with a load factor of 0,76. The fact that the permeate production<br />
increases even though the load factor constantly decreases signifies that the wave power<br />
resource on Site 3 is of a suitable type for the <strong>Aalto</strong>RO process. Still the peak<br />
production is less than in Site 1 (1996 m³/day). The permeate production of Site 3 is<br />
presented in Figure 46.<br />
63<br />
1,2<br />
1<br />
0,8<br />
0,6<br />
0,4<br />
0,2<br />
Load factor