Annual report - About TELUS
Annual report - About TELUS
Annual report - About TELUS

You also want an ePaper? Increase the reach of your titles
YUMPU automatically turns print PDFs into web optimized ePapers that Google loves.
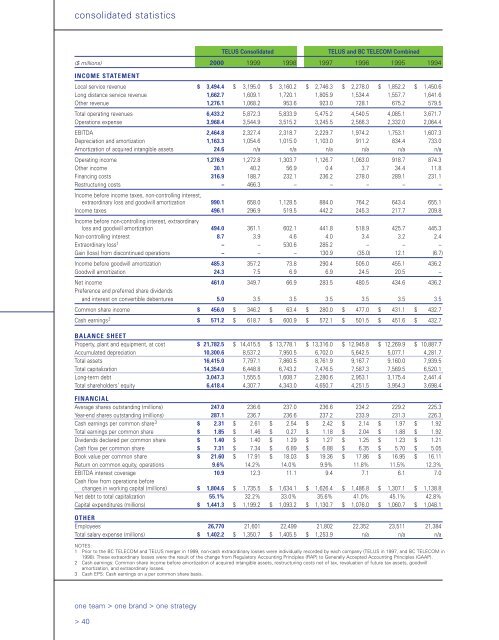
consolidated statistics<br />
one team > one brand > one strategy<br />
> 40<br />
<strong>TELUS</strong> Consolidated <strong>TELUS</strong> and BC TELECOM Combined<br />
($ millions) 2000 1999 1998 1997 1996 1995 1994<br />
INCOME STATEMENT<br />
Local service revenue $ 3,494.4 $ 3,195.0 $ 3,160.2 $ 2,746.3 $ 2,278.0 $ 1,852.2 $ 1,450.6<br />
Long distance service revenue 1,662.7 1,609.1 1,720.1 1,805.9 1,534.4 1,557.7 1,641.6<br />
Other revenue 1,276.1 1,068.2 953.6 923.0 728.1 675.2 579.5<br />
Total operating revenues 6,433.2 5,872.3 5,833.9 5,475.2 4,540.5 4,085.1 3,671.7<br />
Operations expense 3,968.4 3,544.9 3,515.2 3,245.5 2,566.3 2,332.0 2,064.4<br />
EBITDA 2,464.8 2,327.4 2,318.7 2,229.7 1,974.2 1,753.1 1,607.3<br />
Depreciation and amortization 1,163.3 1,054.6 1,015.0 1,103.0 911.2 834.4 733.0<br />
Amortization of acquired intangible assets 24.6 n/a n/a n/a n/a n/a n/a<br />
Operating income 1,276.9 1,272.8 1,303.7 1,126.7 1,063.0 918.7 874.3<br />
Other income 30.1 40.2 56.9 0.4 3.7 34.4 11.8<br />
Financing costs 316.9 188.7 232.1 236.2 278.0 289.1 231.1<br />
Restructuring costs – 466.3 – – – – –<br />
Income before income taxes, non-controlling interest,<br />
extraordinary loss and goodwill amortization 990.1 658.0 1,128.5 884.0 764.2 643.4 655.1<br />
Income taxes<br />
Income before non-controlling interest, extraordinary<br />
496.1 296.9 519.5 442.2 245.3 217.7 209.8<br />
loss and goodwill amortization 494.0 361.1 602.1 441.8 518.9 425.7 445.3<br />
Non-controlling interest 8.7 3.9 4.6 4.0 3.4 3.2 2.4<br />
Extraordinary loss1 – – 530.6 285.2 – – –<br />
Gain (loss) from discontinued operations – – – 130.9 (35.0) 12.1 (6.7)<br />
Income before goodwill amortization 485.3 357.2 73.8 290.4 505.0 455.1 436.2<br />
Goodwill amortization 24.3 7.5 6.9 6.9 24.5 20.5 –<br />
Net income<br />
Preference and preferred share dividends<br />
461.0 349.7 66.9 283.5 480.5 434.6 436.2<br />
and interest on convertible debentures 5.0 3.5 3.5 3.5 3.5 3.5 3.5<br />
Common share income $ 456.0 $ 346.2 $ 63.4 $ 280.0 $ 477.0 $ 431.1 $ 432.7<br />
Cash earnings 2 $ 571.2 $ 618.7 $ 600.9 $ 572.1 $ 501.5 $ 451.6 $ 432.7<br />
BALANCE SHEET<br />
Property, plant and equipment, at cost $ 21,782.5 $ 14,415.5 $ 13,778.1 $ 13,316.0 $ 12,945.8 $ 12,269.9 $ 10,887.7<br />
Accumulated depreciation 10,300.6 8,537.2 7,950.5 6,702.0 5,642.5 5,077.1 4,281.7<br />
Total assets 16,415.0 7,797.1 7,860.5 8,761.9 9,167.7 9,160.0 7,939.5<br />
Total capitalization 14,354.0 6,448.8 6,743.2 7,476.5 7,587.3 7,569.5 6,520.1<br />
Long-term debt 3,047.3 1,555.5 1,608.7 2,280.6 2,953.1 3,175.4 2,441.4<br />
Total shareholders’ equity 6,418.4 4,307.7 4,343.0 4,650.7 4,251.5 3,954.3 3,698.4<br />
FINANCIAL<br />
Average shares outstanding (millions) 247.0 236.6 237.0 236.6 234.2 229.2 225.3<br />
Year-end shares outstanding (millions) 287.1 236.7 236.6 237.2 233.9 231.3 226.3<br />
Cash earnings per common share 3 $ 2.31 $ 2.61 $ 2.54 $ 2.42 $ 2.14 $ 1.97 $ 1.92<br />
Total earnings per common share $ 1.85 $ 1.46 $ 0.27 $ 1.18 $ 2.04 $ 1.88 $ 1.92<br />
Dividends declared per common share $ 1.40 $ 1.40 $ 1.29 $ 1.27 $ 1.25 $ 1.23 $ 1.21<br />
Cash flow per common share $ 7.31 $ 7.34 $ 6.89 $ 6.88 $ 6.35 $ 5.70 $ 5.05<br />
Book value per common share $ 21.60 $ 17.91 $ 18.03 $ 19.36 $ 17.86 $ 16.95 $ 16.11<br />
Return on common equity, operations 9.6% 14.2% 14.0% 9.9% 11.8% 11.5% 12.3%<br />
EBITDA interest coverage 10.9 12.3 11.1 9.4 7.1 6.1 7.0<br />
Cash flow from operations before<br />
changes in working capital (millions) $ 1,804.6 $ 1,735.5 $ 1,634.1 $ 1,626.4 $ 1,486.8 $ 1,307.1 $ 1,138.8<br />
Net debt to total capitalization 55.1% 32.2% 33.0% 35.6% 41.0% 45.1% 42.8%<br />
Capital expenditures (millions) $ 1,441.3 $ 1,199.2 $ 1,093.2 $ 1,130.7 $ 1,076.0 $ 1,060.7 $ 1,048.1<br />
OTHER<br />
Employees 26,770 21,601 22,499 21,802 22,352 23,511 21,384<br />
Total salary expense (millions) $ 1,402.2 $ 1,350.7 $ 1,405.5 $ 1,253.9 n/a n/a n/a<br />
NOTES:<br />
1 Prior to the BC TELECOM and <strong>TELUS</strong> merger in 1999, non-cash extraordinary losses were individually recorded by each company (<strong>TELUS</strong> in 1997, and BC TELECOM in<br />
1998). These extraordinary losses were the result of the change from Regulatory Accounting Principles (RAP) to Generally Accepted Accounting Principles (GAAP).<br />
2 Cash earnings: Common share income before amortization of acquired intangible assets, restructuring costs net of tax, revaluation of future tax assets, goodwill<br />
amortization, and extraordinary losses.<br />
3 Cash EPS: Cash earnings on a per common share basis.

![DISK004:[98CLG6.98CLG3726]BA3726A.;28 - About TELUS](https://img.yumpu.com/16786670/1/190x245/disk00498clg698clg3726ba3726a28-about-telus.jpg?quality=85)