PDF (Thesis) - Nottingham eTheses - University of Nottingham
PDF (Thesis) - Nottingham eTheses - University of Nottingham
PDF (Thesis) - Nottingham eTheses - University of Nottingham
Create successful ePaper yourself
Turn your PDF publications into a flip-book with our unique Google optimized e-Paper software.
CHAPTER 1: INTRODUCTION<br />
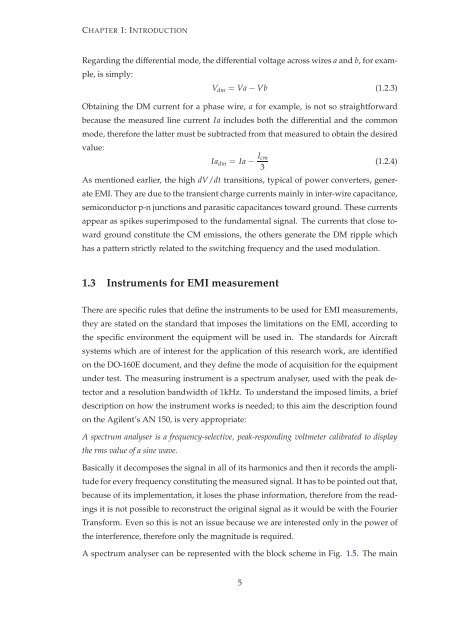
Regarding the differential mode, the differential voltage across wires a and b, for exam-<br />
ple, is simply:<br />
V dm = Va−Vb (1.2.3)<br />
Obtaining the DM current for a phase wire, a for example, is not so straightforward<br />
because the measured line current Ia includes both the differential and the common<br />
mode, therefore the latter must be subtracted from that measured to obtain the desired<br />
value:<br />
Ia dm = Ia− Icm<br />
3<br />
(1.2.4)<br />
As mentioned earlier, the high dV/dt transitions, typical <strong>of</strong> power converters, gener-<br />
ate EMI. They are due to the transient charge currents mainly in inter-wire capacitance,<br />
semiconductor p-n junctions and parasitic capacitances toward ground. These currents<br />
appear as spikes superimposed to the fundamental signal. The currents that close to-<br />
ward ground constitute the CM emissions, the others generate the DM ripple which<br />
has a pattern strictly related to the switching frequency and the used modulation.<br />
1.3 Instruments for EMI measurement<br />
There are specific rules that define the instruments to be used for EMI measurements,<br />
they are stated on the standard that imposes the limitations on the EMI, according to<br />
the specific environment the equipment will be used in. The standards for Aircraft<br />
systems which are <strong>of</strong> interest for the application <strong>of</strong> this research work, are identified<br />
on the DO-160E document, and they define the mode <strong>of</strong> acquisition for the equipment<br />
under test. The measuring instrument is a spectrum analyser, used with the peak de-<br />
tector and a resolution bandwidth <strong>of</strong> 1kHz. To understand the imposed limits, a brief<br />
description on how the instrument works is needed; to this aim the description found<br />
on the Agilent’s AN 150, is very appropriate:<br />
A spectrum analyser is a frequency-selective, peak-responding voltmeter calibrated to display<br />
the rms value <strong>of</strong> a sine wave.<br />
Basically it decomposes the signal in all <strong>of</strong> its harmonics and then it records the ampli-<br />
tude for every frequency constituting the measured signal. It has to be pointed out that,<br />
because <strong>of</strong> its implementation, it loses the phase information, therefore from the read-<br />
ings it is not possible to reconstruct the original signal as it would be with the Fourier<br />
Transform. Even so this is not an issue because we are interested only in the power <strong>of</strong><br />
the interference, therefore only the magnitude is required.<br />
A spectrum analyser can be represented with the block scheme in Fig. 1.5. The main<br />
5


