- Page 1 and 2:
CCNP TSHOOT 6.0 Student Lab Manual
- Page 3 and 4:
CCNPv6 TSHOOT Objectives • Assign
- Page 5 and 6:
CCNPv6 TSHOOT Note: When the show f
- Page 7 and 8:
CCNPv6 TSHOOT Step 10: Test basic n
- Page 9 and 10:
CCNPv6 TSHOOT b. If working as a te
- Page 11 and 12:
CCNPv6 TSHOOT Subnet Table Descript
- Page 13 and 14:
CCNPv6 TSHOOT Task 5: Identify Trou
- Page 15 and 16:
CCNPv6 TSHOOT Router Interface Summ
- Page 17 and 18:
CCNPv6 TSHOOT switchport trunk allo
- Page 19 and 20:
CCNPv6 TSHOOT ! interface FastEther
- Page 21 and 22:
CCNPv6 TSHOOT Switch DLS1 !Lab 3-1
- Page 23 and 24:
CCNPv6 TSHOOT switchport nonegotiat
- Page 25 and 26:
CCNPv6 TSHOOT switchport access vla
- Page 27 and 28:
CCNPv6 TSHOOT ! logging source-inte
- Page 29 and 30:
CCNPv6 TSHOOT interface Port-channe
- Page 31 and 32:
CCNPv6 TSHOOT switchport mode acces
- Page 33 and 34:
CCNPv6 TSHOOT ip address 10.1.100.2
- Page 35 and 36:
CCNPv6 TSHOOT no shutdown ! interfa
- Page 37 and 38:
CCNPv6 TSHOOT ! interface Serial0/0
- Page 39 and 40:
CCNPv6 TSHOOT ip flow ingress encap
- Page 41 and 42:
Logical Topology Objectives Backgro
- Page 43 and 44:
CCNPv6 TSHOOT Section 1—Trouble T
- Page 45 and 46:
CCNPv6 TSHOOT Device Actions and Re
- Page 47 and 48:
CCNPv6 TSHOOT Note: In addition to
- Page 49 and 50:
CCNPv6 TSHOOT Default gateway: 10.1
- Page 51 and 52:
CCNPv6 TSHOOT Section 2—Troublesh
- Page 53 and 54:
CCNPv6 TSHOOT • Address Resolutio
- Page 55 and 56:
CCNPv6 TSHOOT • Spanning-tree top
- Page 57 and 58:
CCNPv6 TSHOOT Sample Layer 2 Troubl
- Page 59 and 60:
CCNPv6 TSHOOT After you have found
- Page 61 and 62:
CCNPv6 TSHOOT ALS1#show etherchanne
- Page 63 and 64:
CCNPv6 TSHOOT Lab 4-1: References I
- Page 65 and 66:
CCNPv6 TSHOOT Logical Topology Obje
- Page 67 and 68:
CCNPv6 TSHOOT Section 1—Trouble T
- Page 69 and 70:
CCNPv6 TSHOOT Device Actions and Re
- Page 71 and 72:
CCNPv6 TSHOOT Note: In addition to
- Page 73 and 74:
CCNPv6 TSHOOT Step 3: Configure SRV
- Page 75 and 76:
CCNPv6 TSHOOT Section 2—Troublesh
- Page 77 and 78:
CCNPv6 TSHOOT Sample Multilayer Swi
- Page 79 and 80:
CCNPv6 TSHOOT Sample Multilayer Swi
- Page 81 and 82:
CCNPv6 TSHOOT epoch 0 sourced in se
- Page 83 and 84:
CCNPv6 TSHOOT Troubleshooting First
- Page 85 and 86:
CCNPv6 TSHOOT Sample First Hop Redu
- Page 87 and 88:
CCNPv6 TSHOOT Sample First Hop Redu
- Page 89 and 90:
CCNPv6 TSHOOT References If you nee
- Page 91 and 92:
CCNPv6 TSHOOT Logical Topology Obje
- Page 93 and 94:
CCNPv6 TSHOOT Section 1—Trouble T
- Page 95 and 96:
CCNPv6 TSHOOT Device Actions and Re
- Page 97 and 98:
CCNPv6 TSHOOT Device Actions and Re
- Page 99 and 100:
CCNPv6 TSHOOT Step 6: Record the tr
- Page 101 and 102:
CCNPv6 TSHOOT Note: In addition to
- Page 103 and 104:
CCNPv6 TSHOOT Step 3: Configure SRV
- Page 105 and 106:
CCNPv6 TSHOOT Section 2 - Troublesh
- Page 107 and 108:
CCNPv6 TSHOOT Layer 3 is a common s
- Page 109 and 110:
CCNPv6 TSHOOT reachability of the n
- Page 111 and 112:
CCNPv6 TSHOOT associated egress int
- Page 113 and 114:
CCNPv6 TSHOOT The usual trigger to
- Page 115 and 116:
CCNPv6 TSHOOT Specifically, the %DU
- Page 117 and 118:
CCNPv6 TSHOOT Hop count is 2 10.1.1
- Page 119 and 120:
CCNPv6 TSHOOT If you find that an E
- Page 121 and 122:
CCNPv6 TSHOOT References If you nee
- Page 123 and 124:
CCNPv6 TSHOOT Logical Topology (Bas
- Page 125 and 126:
CCNPv6 TSHOOT Phase 1 OSPF Network
- Page 127 and 128:
CCNPv6 TSHOOT After the completion
- Page 129 and 130:
CCNPv6 TSHOOT Note: In addition to
- Page 131 and 132:
CCNPv6 TSHOOT Step 3: Configure SRV
- Page 133 and 134:
CCNPv6 TSHOOT R3 Lab51-R3-TT-C-Cfg.
- Page 135 and 136:
CCNPv6 TSHOOT Task 4: Trouble Ticke
- Page 137 and 138:
CCNPv6 TSHOOT Step 7: Document trou
- Page 139 and 140:
CCNPv6 TSHOOT debug ip ospf packet
- Page 141 and 142:
CCNPv6 TSHOOT R1#show ip ospf inter
- Page 143 and 144:
CCNPv6 TSHOOT • Area ID (aid): Th
- Page 145 and 146:
CCNPv6 TSHOOT Nov 5 16:06:39.809: O
- Page 147 and 148:
CCNPv6 TSHOOT Sample OSPF Troublesh
- Page 149 and 150:
CCNPv6 TSHOOT LS Type: Summary Link
- Page 151 and 152:
CCNPv6 TSHOOT Boundary (ASB) entry
- Page 153 and 154:
CCNPv6 TSHOOT Sample Route Redistri
- Page 155 and 156:
CCNPv6 TSHOOT Sample Route Redistri
- Page 157 and 158:
CCNPv6 TSHOOT Sample Route Redistri
- Page 159 and 160:
CCNPv6 TSHOOT Reflection Questions
- Page 161 and 162:
CCNPv6 TSHOOT Chapter 5 Lab 5-3, BG
- Page 163 and 164:
CCNPv6 TSHOOT ISP, it has been deci
- Page 165 and 166:
CCNPv6 TSHOOT Lab Structure This la
- Page 167 and 168:
CCNPv6 TSHOOT Step 5: Outline the t
- Page 169 and 170: CCNPv6 TSHOOT Step 3: Configure SRV
- Page 171 and 172: CCNPv6 TSHOOT Device Configuration
- Page 173 and 174: CCNPv6 TSHOOT Section 2—Troublesh
- Page 175 and 176: CCNPv6 TSHOOT The typical trigger t
- Page 177 and 178: CCNPv6 TSHOOT • Number of receive
- Page 179 and 180: CCNPv6 TSHOOT You can use the debug
- Page 181 and 182: CCNPv6 TSHOOT Sample BGP Troublesho
- Page 183 and 184: CCNPv6 TSHOOT 172.24.244.86 (metric
- Page 185 and 186: CCNPv6 TSHOOT Sample BGP Troublesho
- Page 187 and 188: CCNPv6 TSHOOT References If you nee
- Page 189 and 190: CCNPv6 TSHOOT Logical Topology (Bas
- Page 191 and 192: CCNPv6 TSHOOT Physical and Logical
- Page 193 and 194: CCNPv6 TSHOOT Step 5: Outline the t
- Page 195 and 196: CCNPv6 TSHOOT Step 3: Configure SRV
- Page 197 and 198: CCNPv6 TSHOOT Device Configuration
- Page 199 and 200: CCNPv6 TSHOOT Step 7: Document trou
- Page 201 and 202: CCNPv6 TSHOOT debug dhcp detail deb
- Page 203 and 204: CCNPv6 TSHOOT R2#debug ip icmp Nov
- Page 205 and 206: CCNPv6 TSHOOT R3(config)#int f0/0 R
- Page 207 and 208: CCNPv6 TSHOOT Chapter 7 Lab 7-1, Ro
- Page 209 and 210: CCNPv6 TSHOOT Section 1—Trouble T
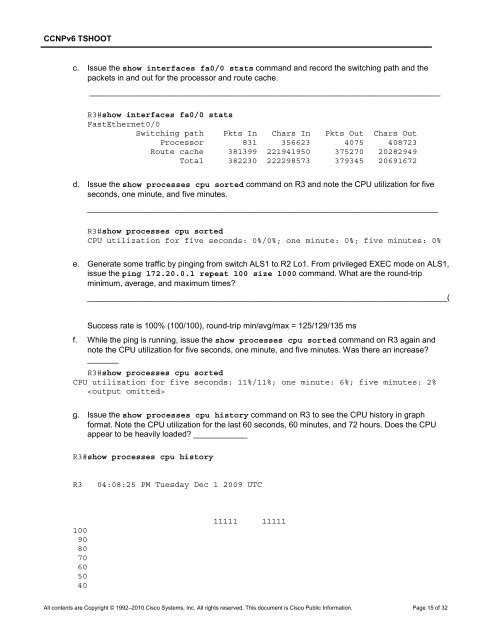
- Page 211 and 212: CCNPv6 TSHOOT b. Issue the show int
- Page 213 and 214: CCNPv6 TSHOOT 60 50 40 30 20 10 0..
- Page 215 and 216: CCNPv6 TSHOOT Referring to the abov
- Page 217 and 218: CCNPv6 TSHOOT R3#show processes cpu
- Page 219: CCNPv6 TSHOOT Device Actions and Re
- Page 223 and 224: CCNPv6 TSHOOT 219 0 469096 18304 43
- Page 225 and 226: CCNPv6 TSHOOT Reply from 172.20.0.1
- Page 227 and 228: CCNPv6 TSHOOT 4. Examine the router
- Page 229 and 230: CCNPv6 TSHOOT Section 2—Troublesh
- Page 231 and 232: CCNPv6 TSHOOT Switching path Pkts I
- Page 233 and 234: CCNPv6 TSHOOT The output from the s
- Page 235 and 236: CCNPv6 TSHOOT R3#show memory statis
- Page 237 and 238: CCNPv6 TSHOOT References If you nee
- Page 239 and 240: CCNPv6 TSHOOT Chapter 9 Lab 9-1, Ma
- Page 241 and 242: CCNPv6 TSHOOT Section 1—Trouble T
- Page 243 and 244: CCNPv6 TSHOOT Device Actions and Re
- Page 245 and 246: CCNPv6 TSHOOT Step 3: Configure SRV
- Page 247 and 248: CCNPv6 TSHOOT Section 2—Troublesh
- Page 249 and 250: CCNPv6 TSHOOT In the above example,
- Page 251 and 252: CCNPv6 TSHOOT DLS1(config)# Dec 6 1
- Page 253 and 254: CCNPv6 TSHOOT Dead: total time 0s,
- Page 255 and 256: CCNPv6 TSHOOT Inbound access list i
- Page 257 and 258: CCNPv6 TSHOOT Appendix A—WinRadiu
- Page 259 and 260: CCNPv6 TSHOOT Step 4: Configure use
- Page 261 and 262: CCNPv6 TSHOOT Chapter 9 Lab 9-2, Co
- Page 263 and 264: CCNPv6 TSHOOT Section 1—Trouble T
- Page 265 and 266: CCNPv6 TSHOOT Step 7: Document trou
- Page 267 and 268: CCNPv6 TSHOOT Device Actions and Re
- Page 269 and 270: CCNPv6 TSHOOT Sample Troubleshootin
- Page 271 and 272:
CCNPv6 TSHOOT F 0x0 *Mar 1 09:10:36
- Page 273 and 274:
CCNPv6 TSHOOT Dec 11 14:28:15.542:
- Page 275 and 276:
CCNPv6 TSHOOT route ia - IS-IS inte
- Page 277 and 278:
CCNPv6 TSHOOT References If you nee
- Page 279 and 280:
CCNPv6 TSHOOT Background Routers an
- Page 281 and 282:
CCNPv6 TSHOOT Section 1—Trouble T
- Page 283 and 284:
CCNPv6 TSHOOT Device Actions and Re
- Page 285 and 286:
CCNPv6 TSHOOT Device Actions and Re
- Page 287 and 288:
CCNPv6 TSHOOT Sample Troubleshootin
- Page 289 and 290:
CCNPv6 TSHOOT hp-collector HP Perfo
- Page 291 and 292:
CCNPv6 TSHOOT R1#show ntp status Cl
- Page 293 and 294:
CCNPv6 TSHOOT References If you nee
- Page 295 and 296:
CCNPv6 TSHOOT Background This lab c
- Page 297 and 298:
CCNPv6 TSHOOT Step 5: Outline the t
- Page 299 and 300:
CCNPv6 TSHOOT Task 2: Trouble Ticke
- Page 301 and 302:
CCNPv6 TSHOOT Command Key Informati
- Page 303 and 304:
CCNPv6 TSHOOT Step 5: Outline the t
- Page 305 and 306:
CCNPv6 TSHOOT Task 4: Trouble Ticke
- Page 307 and 308:
CCNPv6 TSHOOT Command Key Informati
- Page 309 and 310:
CCNPv6 TSHOOT Reflection Questions