CCNP TSHOOT 6.0 - The Cisco Learning Network
CCNP TSHOOT 6.0 - The Cisco Learning Network
CCNP TSHOOT 6.0 - The Cisco Learning Network

Create successful ePaper yourself
Turn your PDF publications into a flip-book with our unique Google optimized e-Paper software.
<strong>CCNP</strong>v6 <strong>TSHOOT</strong><br />
Section 2—Troubleshooting Reference Information<br />
General Troubleshooting Process<br />
As a general guideline, you can use the following general troubleshooting process described in the course.<br />
1. Define the problem (symptoms).<br />
2. Gather information.<br />
3. Analyze the information.<br />
4. Propose a hypothesis (possible cause).<br />
5. Test the hypothesis.<br />
6. Eliminate or accept the hypothesis.<br />
7. Solve the problem.<br />
8. Document the problem.<br />
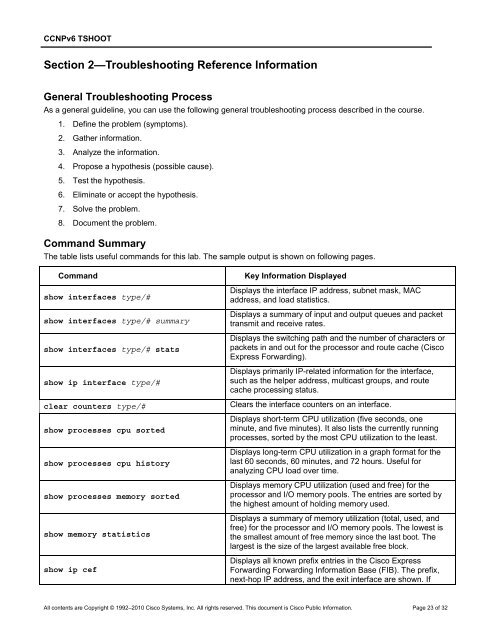
Command Summary<br />
<strong>The</strong> table lists useful commands for this lab. <strong>The</strong> sample output is shown on following pages.<br />
Command Key Information Displayed<br />
show interfaces type/#<br />
show interfaces type/# summary<br />
show interfaces type/# stats<br />
show ip interface type/#<br />
clear counters type/#<br />
show processes cpu sorted<br />
show processes cpu history<br />
show processes memory sorted<br />
show memory statistics<br />
show ip cef<br />
Displays the interface IP address, subnet mask, MAC<br />
address, and load statistics.<br />
Displays a summary of input and output queues and packet<br />
transmit and receive rates.<br />
Displays the switching path and the number of characters or<br />
packets in and out for the processor and route cache (<strong>Cisco</strong><br />
Express Forwarding).<br />
Displays primarily IP-related information for the interface,<br />
such as the helper address, multicast groups, and route<br />
cache processing status.<br />
Clears the interface counters on an interface.<br />
Displays short-term CPU utilization (five seconds, one<br />
minute, and five minutes). It also lists the currently running<br />
processes, sorted by the most CPU utilization to the least.<br />
Displays long-term CPU utilization in a graph format for the<br />
last 60 seconds, 60 minutes, and 72 hours. Useful for<br />
analyzing CPU load over time.<br />
Displays memory CPU utilization (used and free) for the<br />
processor and I/O memory pools. <strong>The</strong> entries are sorted by<br />
the highest amount of holding memory used.<br />
Displays a summary of memory utilization (total, used, and<br />
free) for the processor and I/O memory pools. <strong>The</strong> lowest is<br />
the smallest amount of free memory since the last boot. <strong>The</strong><br />
largest is the size of the largest available free block.<br />
Displays all known prefix entries in the <strong>Cisco</strong> Express<br />
Forwarding Forwarding Information Base (FIB). <strong>The</strong> prefix,<br />
next-hop IP address, and the exit interface are shown. If<br />
All contents are Copyright © 1992–2010 <strong>Cisco</strong> Systems, Inc. All rights reserved. This document is <strong>Cisco</strong> Public Information. Page 23 of 32