CG malls europe - Commerz Real
CG malls europe - Commerz Real
CG malls europe - Commerz Real

Create successful ePaper yourself
Turn your PDF publications into a flip-book with our unique Google optimized e-Paper software.
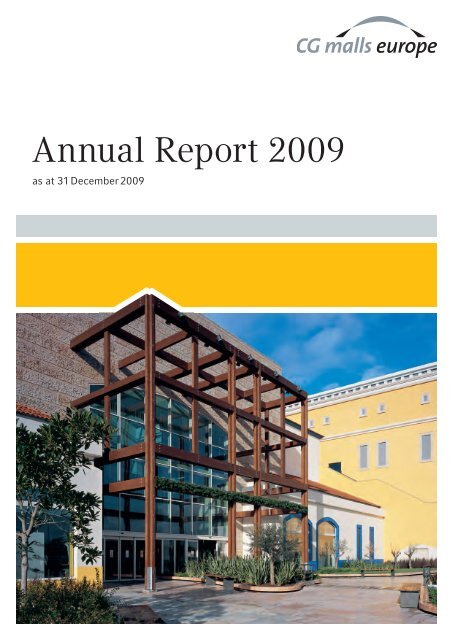
Annual Report 2009<br />
as at 31 December 2009
Content<br />
General Information 2<br />
At a Glance 5<br />
Financials 6<br />
Manager’s Report 10<br />
Property Report 28<br />
Financial Report 52<br />
Valuers Statements 58<br />
Financial Statements 61<br />
Last updated: 07 July 2010<br />
1
2<br />
General Information<br />
Fund name: <strong>CG</strong> <strong>Real</strong> Estate Master FCP-SIF<br />
Sub-Fund name: <strong>CG</strong> <strong>malls</strong> <strong>europe</strong><br />
Seat Luxembourg<br />
Legal form Fonds Commun de Placement (FCP)<br />
ISIN LU0331534734 (Class A Units)<br />
Management Company <strong>CG</strong> <strong>Real</strong> Estate Luxembourg S.à r.l.<br />
25, rue Edward Steichen<br />
L-2540 Luxembourg<br />
Managing Directors:<br />
Dr. Bernhard Weber<br />
Detlef Koppenhagen<br />
Contact Constanze Gabellini<br />
Management Assistant<br />
Tel.: +352 47 79 11 25 02<br />
Fax.: +352 47 79 11 25 99<br />
constanze.gabellini@commerzbank.com<br />
Investment Committee Dr. Frank Pörschke (Chairman)<br />
Bernd Knobloch<br />
Dr. Heinrich Kraft<br />
Unitholder Advisory Committee Aberdeen Property Investors Netherlands B.V.<br />
MN Services Vermogensbeheer B.V.<br />
Schroder Investment Management Limited<br />
<strong>Commerz</strong> <strong>Real</strong> AG
General service provider <strong>Commerz</strong> <strong>Real</strong> AG<br />
Kreuzberger Ring 56<br />
D-65205 Wiesbaden<br />
Germany<br />
Contact Detlef Koppenhagen<br />
Fund Director <strong>CG</strong> <strong>malls</strong> <strong>europe</strong><br />
Tel.: +49 611 71 05 408<br />
Fax.: +49 611 71 05 159<br />
detlef.koppenhagen@commerzreal.com<br />
Custodian, administrative agent, Brown Brothers Harriman (Luxembourg) S.C.A.<br />
paying agent and registrar and 2-8, Avenue Charles de Gaulle<br />
transfer agent B.P. 403<br />
L-2014 Luxembourg<br />
Valuer Cushman & Wakefield<br />
Westhafenplatz 6<br />
D-60327 Frankfurt am Main<br />
Germany<br />
Auditor PriceWaterhouseCoopers S.à r.l.<br />
400, route d’Esch<br />
B.P. 1443<br />
L-1014 Luxembourg<br />
Legal advisor Linklaters LLP Luxembourg<br />
35, Avenue John F. Kennedy<br />
P.O. Box 1107<br />
L-1855 Luxembourg<br />
Linklaters LLP Germany<br />
Mainzer Landstr. 16<br />
D-60325 Frankfurt am Main<br />
Germany<br />
3
Almada Forum
At a Glance<br />
Property information<br />
as at 31 December 2009 Almada Forum Forum Montijo Espacio León Total<br />
Country Portugal Portugal Spain<br />
Location Almada Montijo León<br />
Total GLA (sqm) 81,400 58,200 36,500 176,100<br />
Thereof hypermarket (sqm) 21,900 17,500 0 39,400<br />
GLA without hypermarket (sqm) 59,500 40,700 36,500 136,700<br />
Parking spaces 5,253 3,900 1,339 10,492<br />
No. of Shops 253 163 113 529<br />
Current market value<br />
(million EUR) 333.6 154.5 77.7 565.8<br />
Property information<br />
01 Jan 2009 – 31 Dec 2009<br />
Sales (million EUR) 209.9 116.1 79.5 405.5<br />
Footfall (million) 15.4 8.6 4.7 28.7<br />
<strong>CG</strong> <strong>malls</strong> <strong>europe</strong> capital commitments<br />
as at 31 December 2009 in EUR<br />
Total capital committed 290,000,000.00<br />
Capital drawn and invested 290,000,000.00<br />
Remaining capital commitments 0.00<br />
5
6<br />
Financials<br />
Balance Sheet by Fund GAAP<br />
as at 31 December 2009<br />
Assets<br />
Investment properties (market value) 565,818,000.00<br />
Other assets 50,789,162.33<br />
Gross asset value (GAV) 616,607,162.33<br />
Liabilities<br />
External debt 377,963,687.51<br />
Other liabilities 31,457,042.95<br />
Total liabilities 409,420,730.46<br />
Net asset value (NAV) 207,186,431.87<br />
Share capital 290,000,000.00<br />
Reserves -82,813,568.13<br />
Total units 2,900,000.00<br />
NAV per unit 71.44
Profit & Loss Accounts by Fund GAAP<br />
for the Period 01 January 2009 – 31 December 2009<br />
Revenues 56,415,259.00<br />
Interest income 104,053.00<br />
Other operating income -604,237.98<br />
Total income 55,915,074.02<br />
Operating expenses -23,973,486.37<br />
Operating result 31,941,587.65<br />
Unrealised gain/loss in Inv. Properties -48,647,000.00<br />
Finance costs -20,494,121.00<br />
Non-operating costs -792.44<br />
Result before tax - 37,200,325.79<br />
Total income taxes -778,629.89<br />
Loss of the period -37,978,955.68<br />
Distribution for 2009<br />
Total Distribution 9,425,00.00<br />
per unit 3.25<br />
Cash-on-cash return on signed equity 3.25%<br />
For 2009, the management will distribute EUR 3,25 per share on 19 July 2010.<br />
Financials<br />
7
Almada Forum
Forum Montijo<br />
Espacio León
10<br />
Manager‘s Report on the Fund<br />
On 19 October 2007, <strong>CG</strong> <strong>Real</strong> Estate Luxembourg S.à r.l. launched its first sub-fund under<br />
the umbrella of <strong>Commerz</strong> <strong>Real</strong> Estate Master FCP-SIF by issuing the draw-down notices<br />
for <strong>CG</strong> <strong>malls</strong> <strong>europe</strong> to investors. By 26 October 2007, the drawn capital was received by<br />
our investors in order to purchase the Fund’s seed portfolio on 31 October 2007.<br />
This report is based both on the INREV Reporting Guidelines and the reporting standards<br />
for other real estate fund’s of <strong>Commerz</strong> <strong>Real</strong>, especially the open-ended real estate<br />
funds, and should provide sufficient information on <strong>CG</strong> <strong>malls</strong> <strong>europe</strong>.<br />
1. Strategy of <strong>CG</strong> <strong>malls</strong> <strong>europe</strong><br />
<strong>CG</strong> <strong>malls</strong> <strong>europe</strong>’s strategy is to invest in dominant regional shopping centres with the aim<br />
of creating a portfolio, diversified both by geography and by real estate type. We define dominant<br />
regional shopping centres as schemes which generally meet the following criteria:<br />
1. The centre will typically have a gross lettable area of at least 35,000 sqm (although,<br />
depending on the size of the relevant market, 25,000 sqm may suffice).<br />
2. The centre will typically have a branch and tenant mix aligned with consumer<br />
spending.<br />
3. The centre will typically have a professional centre management.<br />
4. The centre will typically be integrated into a city or city district.<br />
However, on an individual basis, greenfield locations are permissible if the centre is or<br />
has the potential to become the dominant shopping centre destination within its catchment<br />
area. The relative importance of each of these characteristics varies when determining<br />
whether a property is a suitable asset for the Portfolio. In other words, the abovementioned<br />
criteria are important but not compulsory for the assets held by the Fund.<br />
The Fund’s relevant target markets consist of the member states of the European Union<br />
plus Norway and Switzerland, and present candidate countries to the European Union<br />
Croatia, Macedonia and Turkey. However, in order to reduce country risks and meet the<br />
requirements of our investors, the two member states most recently admitted to the EU,<br />
Bulgaria and Romania, were excluded until January 2009.<br />
2. Economic Environment<br />
2.1 Macroeconomic View<br />
The European Economy (EU 27) contracted by 4.2% over the whole 2009 compared<br />
with +0.7% in 2008. The recession in the EU 27 bottomed out in the summer of the last<br />
year when GDP declined by -4.3% in Q3 followed by + 2.2 in Q4. Apart from Poland, all<br />
member states saw a negative GDP Growth rate. With -18% Latvia recorded the strongest<br />
decline over the year. For 2010 we are estimating that the GDP in the EU 27 will<br />
grow by 1.2% in total.
GDP Growth Rate Aggregated in % p.a.<br />
in %<br />
7<br />
5<br />
3<br />
1<br />
-1<br />
-3<br />
-5<br />
2003 2004 2005 2006 2007 2008 2009 2010e 2011e 2012e 2013e 2014e<br />
Source: The Economist Intelligence Unit, May 2010<br />
Source: The Economist Intelligence Unit, May 2010<br />
Preliminary figures are showing that during the first three months of 2010 the GDP<br />
growth rate was stronger than in Q4 and we are expecting a rate of 0.5% (qoq). The<br />
recovery is still below trend and not without downside risk. Concerns are how authorities<br />
will manage to withdraw their extraordinary fiscal and monetary policy, the social<br />
and fiscal situation in the PIIGS (Portugal, Ireland, Italy, Greece and Spain) and how the<br />
private sector in countries like Ireland and Spain will write off debt.<br />
With a view to the global recession, the uncertainty at the beginning of 2009, and the<br />
growing unemployment rates in all member states, it is not surprising that private<br />
consumption was negative in 2009 for most of the <strong>CG</strong> <strong>malls</strong> <strong>europe</strong> target countries.<br />
In recent years, the average growth rate for private consumption was 2%, but consumers<br />
have significantly cut down on their spending since the onset of the crisis, and<br />
for the first time since the late 1970s private consumption was negative (-1.7%). As a<br />
consequence, retail turnover between Q2 2008 and Q3 2009 was negative in most of the<br />
countries covered.<br />
Retail Turnover in % p.m.<br />
3<br />
2<br />
1<br />
0<br />
-1<br />
-2<br />
-3<br />
-4<br />
-5<br />
Jan 06<br />
Apr 06<br />
Jul 06<br />
Oct 06<br />
EU 27 East and Central Europe Nordics Southern Europe<br />
Jan 07<br />
Apr 07<br />
Source:<br />
Source:<br />
EuroStat.<br />
EuroStat,<br />
*3-months<br />
*3 Months<br />
rolling<br />
roling<br />
average;<br />
average;<br />
excluding<br />
excluding<br />
Automotive,<br />
Automotive,<br />
SA. May<br />
SA.<br />
2010<br />
May 2010<br />
Jul 07<br />
Oct 07<br />
EU 27 Germany France Spain<br />
Jan 08<br />
Apr 08<br />
Jul 08<br />
Oct 08<br />
Jan 09<br />
Apr 09<br />
Jul 09<br />
Oct 09<br />
Jan 10<br />
Manager‘s Report on the Fund<br />
11
12<br />
For 2010, the Economist Intelligence Unit is forecasting a positive consumption growth<br />
in the majority of the European countries, whereas the outlook for the Baltics, the Czech<br />
Republic, Hungary, Spain and the UK remains negative.<br />
Private Consumption Growth in % p.a.<br />
5<br />
0<br />
-5<br />
-10<br />
FI SE DK PL AT FR SK PT IT BE RO DE CZ NL GB ES HU IE<br />
Source: The Source: Economist The Economist Intelligence Intelligence Unit, May Unit, 2010May<br />
2010<br />
All segments of the European Sentiment Indicator improved over the last year. This is<br />
to some extent explained by the fact that the fear of unemployment eased during the<br />
second half of 2009 and that order books in the industry began to fill again. Retailer and<br />
consumer sentiment has improved steadily since Q1 2009, and is now (as at April 2010)<br />
back on a level last seen two years ago. The majority of retailers are “literally” positive<br />
(+0.3 points) as for their current situation, while the consumer sentiment is still below<br />
“neutral” (-12.3 Points). Also, the improved result of the European Purchasing Manager<br />
Index (PMI) suggests that the economy in Europe is recovering: The worst is over! That<br />
said, we need to differentiate between the specific situations in each sector: Whereas<br />
wariness lingers in the building and construction industry, the service sector industry<br />
appears to be in high spirits.<br />
European Sentiment Indicator<br />
20<br />
10<br />
0<br />
-10<br />
-20<br />
-30<br />
-40<br />
Jan 07<br />
Apr 07<br />
Source: EuroStat, May 2010<br />
Source: EuroStat May 2010<br />
2009 2010e 2011e<br />
Retail Sentiment Consumer Sentiment European Sentiment Indicator<br />
Jul 07<br />
Oct 07<br />
Jan 08<br />
Apr 08<br />
Jul 08<br />
Oct 08<br />
Jan 09<br />
Apr 09<br />
Jul 09<br />
Oct 09<br />
Jan 10<br />
Apr 10<br />
140<br />
100<br />
60<br />
20<br />
-20
Even though the aforementioned indicators show that the situation is returning to normal,<br />
we need to remember that economic growth is rebounding from a low level, and<br />
that we are still a long way from a “normal” economy: a regression cannot be ruled out!<br />
The current situation in the so called PIIGS states and the implication for the Eurozone<br />
open onto a potential risk for the near future. The one-million-Dollar question is just how<br />
the current turmoil of the Euro currency will affect the real economy.<br />
2.1 Retail Market<br />
Negative consumer spending and weak retail sales caused shopping centre development<br />
to slow significantly last year. Instead of nearly 10 million sqm of new space completed<br />
as expected for 2009, only 8 million sqm were delivered. But while a lot of announced<br />
projects have been shelved in Spain and Italy, Russia and Turkey saw plenty of activity in<br />
2009. In the course of the year, 127 shopping centre developments were postponed. In<br />
Western Europe, the pipeline for France remains intact, yet one third of the upcoming<br />
projects are actually refurbishments explained by the obsolete stock of the French shopping<br />
centre market.<br />
The decreasing demand for shopping centre space is translating into higher vacancy<br />
rates. Most affected are shopping centres with an insufficient tenant mixture and / or<br />
location, while successful prime centres attract a higher footfall and more retailers.<br />
Even when the average performance of shopping centres in Europe turned into negative<br />
growth in 2008 and 2009, sound assets (good location, good management, etc.) remained<br />
robust and saw positive growth.<br />
Total Returns in <strong>Real</strong> Estate Market?<br />
0<br />
-5<br />
-10<br />
-15<br />
-20<br />
-25<br />
-30<br />
-35<br />
FR DE IE IT NL PL ES SE UK<br />
Source: JPMA, based in IPD, May 2010<br />
Source: JPMA, based in IPD, May 2010<br />
2008 2009<br />
Manager‘s Report on the Fund<br />
13
14<br />
Larger shopping centres of more than 40,000 sqm tend to show an above-average performance.<br />
This is true especially for Dominant Regional Shopping Centres, which benefit<br />
from a controlling position within a given catchment area that can be sustained strategically.<br />
The average vacancy rate at this type of mall undercuts 4% (up from < 3% in<br />
2008) while smaller centres tend to have a vacancy rate nearly twice as high (7.9% based<br />
on ten countries).<br />
Vacancy Rates in Shopping Center > 40,000 sqm<br />
in %<br />
10<br />
8<br />
6<br />
4<br />
2<br />
0<br />
Source: PMA, May 2010<br />
Source: PMA, May 2010<br />
Vacancy rates differ from one region to the next. In Spain and the UK, where the economic<br />
downturn started earlier, vacancy rates are above the European average. Property<br />
Market Analysis Ltd. (PMA) reported that the vacancy rate in Dominate Regional Shopping<br />
Centre reached 9% (2008: 7%) in the UK and 8% (2008: 5%) in Spain. By contrast,<br />
countries where the economic downturn started later, and where the private consumption<br />
was not fed by a housing bubble, the vacancy rate in large shopping centres remains<br />
relative low (e.g. Germany 2%, France 3% and Poland 2%). In Portugal, the vacancy rate<br />
for this market segment decreased from 3.1% in 2008 to 2.1% in 2009.<br />
European Direct <strong>Real</strong> Estate Investment Volumes<br />
300<br />
250<br />
200<br />
150<br />
100<br />
50<br />
0<br />
23.6<br />
39.6<br />
Source: Jones Lang LaSalle, May 2010<br />
(EUR, Source: bn) Data Jones excludes Lang Residential, LaSalle, Land and may Developments, 2010 deals considered >USD 5 million<br />
2008 2009<br />
DE PL CZ PT FR IT ES HU UK<br />
24.9<br />
34.0<br />
48.0 51.0<br />
56.0<br />
74.2<br />
97.2<br />
73.8 77.0 76.7<br />
2000 2001 2002 2003 2004 2005 2006 2007 2008 2009<br />
(EUR, bn) Data excludes Residential, Land and Developments,<br />
deals considered >USD 5 million<br />
Cross-Border Domestic<br />
156.4 153.5<br />
96.8 90.6<br />
62.9<br />
33.4<br />
49.5 35.7
During the first quarter of 2009, the European retail investment market reached its low<br />
point. The biggest problem in 2009 was the absence of the debt securitisation market,<br />
and only large equity players where active during the first half of 2009. Investors where<br />
seeking for core assets mainly in the UK, the Netherlands, France and Germany. During<br />
the second half of the year, activities picked up in all European countries. At EUR 8.1 billion,<br />
Q4 2009 registered the highest retail investment volume since Q3 2008. For 2009,<br />
the total retail investment volume for the whole of Europe amounted to some EUR 20<br />
billion, that is, down by a third compared to 2008. With a 28% share of the total volume,<br />
retail investments remained virtually stable in comparison to 2008.<br />
European Direct <strong>Real</strong> Estate Investments by Sectors<br />
100%<br />
80%<br />
60%<br />
40%<br />
20%<br />
0%<br />
27%<br />
19%<br />
54%<br />
21%<br />
24%<br />
55%<br />
26%<br />
25%<br />
49%<br />
32%<br />
24%<br />
44 %<br />
24%<br />
26%<br />
50%<br />
2000 2001 2002 2003 2004 2005 2006 2007 2008 2009<br />
Source: Jones Lang LaSalle, May 2010<br />
30%<br />
27%<br />
43%<br />
Others Retail Office<br />
26%<br />
25%<br />
49%<br />
27%<br />
21%<br />
53%<br />
Source: Jones Lang LaSalle, May 2010<br />
(EUR, bn) Data excludes Residential, Land and Developments, deals considered >USD 5 million<br />
(EUR, bn) Data excludes Residential, Land and Developments,<br />
21%<br />
27%<br />
50%<br />
22%<br />
28%<br />
51%<br />
Investor’s<br />
deals<br />
interest<br />
considered<br />
in shopping<br />
>USD<br />
centres<br />
5 million<br />
very much concentrated on the prime end of the<br />
market. Therefore the average prime yield for this market segment started to stabilize<br />
in Western Europe after an increase of nearly 150 base points between 2007 and the<br />
first half of 2009. During the second half of 2009, the average prime yield came down<br />
by 20 base points to 6.1%. This decrease was mainly driven by pricing in the UK, where<br />
the prime yield decreased from 7% in Q1 to 6.25% in Q4 2009. Yields for secondary<br />
shopping centres started to stabilise, but there is not much market evidence to substantiate<br />
the pricing.<br />
Manager‘s Report on the Fund<br />
15
16<br />
Shopping Centre Prime Initial Yields (1998-2010)<br />
in%<br />
12<br />
10<br />
8<br />
6<br />
4<br />
Source: <strong>Commerz</strong> Source: <strong>Commerz</strong> <strong>Real</strong>, May <strong>Real</strong>, 2010 May 2010<br />
The distinguishing feature of regional shopping centres is that they generate long-term<br />
stable revenues even in periods of market imbalances. It is obviously easier for larger<br />
shopping centre schemes to use their diversified portfolio of tenants to diffuse the risk<br />
of falling rents. Well-planned shopping centre layouts allow centre managers to adjust<br />
retail space to meet the requirements of new tenants and to adapt retail formats to the<br />
latest market trends.<br />
Density of Shopping Centres of More than 35,000 sqm GLA in Europe<br />
35,000m² - 50,000m²<br />
50,000m² - 80,000m²<br />
over 80,000m²<br />
Source: GfK (2008)<br />
Western Europe Scandinavia CEE<br />
1998 1999 2000 2001 2002 2003 2004 2005 2006 2007 2008 2009 2010
The relevant European investment universe comprises the EU 27 countries, Norway and<br />
Switzerland, as well as the EU candidate countries Croatia, Macedonia and Turkey. In<br />
total, this territory includes about 700 potential acquisition targets larger than 35,000<br />
sqm GLA (see figure 7), among them <strong>malls</strong> under construction or showing repositioning<br />
potential. In order to allow for a structured investment approach, the regions in<br />
which those centres are located will be classified according to their market maturity<br />
into the categories “core” and “emerging market”. The major differentiating features<br />
in this context are the proportionate density of competitors as measured by shopping<br />
centre supply per 1,000 population and growth of retail-specific real purchasing power.<br />
<strong>Commerz</strong> <strong>Real</strong> believes that the purchasing power within the relevant catchment area<br />
constitutes the key factor for the success of a retail centre. The analysis identified the<br />
following categories:<br />
(a) European core markets:<br />
Austria, Belgium, Denmark, Finland, France, Germany, Ireland, Italy, Luxembourg,<br />
the Netherlands, Norway, Portugal, Spain, Sweden, Switzerland and the United<br />
Kingdom.<br />
(b) European emerging markets:<br />
Croatia, Cyprus, Czech Republic, Estonia, Greece, Hungary, Latvia, Lithuania, Macedonia,<br />
Malta, Poland, Slovakia, Slovenia, and Turkey (including Bulgaria and Romania,<br />
even though fund regulations excluded them from commitments until January<br />
2009).<br />
Categories of Target Countries<br />
GLA/1,000 Population<br />
700<br />
600<br />
500<br />
400<br />
300<br />
200<br />
Netherlands<br />
Ireland<br />
100<br />
Latvia<br />
Malta<br />
Czech Republic<br />
Hungary<br />
Greece<br />
-2 -1<br />
0<br />
0 1 2 3 4 5<br />
Poland<br />
DE<br />
BE<br />
Croatia<br />
Lithuania<br />
Slovakia<br />
Turkey<br />
Bulgaria<br />
Romania<br />
Forecasted CAGR of <strong>Real</strong> Consumer Spending (Ø 2010 - 2014 in % p. a.)<br />
Source: Cushman & Wakefield, GFK, The Economist Intelligence Unit, May 2010<br />
PT<br />
Italy<br />
UK<br />
CH<br />
Austria<br />
Sweden<br />
France FI<br />
ES Lux.<br />
DK<br />
Estonia<br />
Norway<br />
Core<br />
Emerging<br />
Forecasted CAGR of <strong>Real</strong> Consumer Spending (Ø 2010 - 2014 in % p. a.)<br />
Source: Cushman & Wakefield, GFK, The Economist Intelligence Unit, May 2010<br />
Manager‘s Report on the Fund<br />
17
18<br />
As the figure above shows, many Western European countries show medium to high<br />
saturation in terms of shopping centre density (which is especially true for Austria, Ireland,<br />
Italy, the Netherlands and Norway) and slower growth prospects in the long term<br />
for consumer spending (mainly Ireland, the Netherlands, Portugal, and the UK). Compared<br />
to these core markets, emerging markets show a low to medium density of retail<br />
areas but also the highest growth expectations for long-term consumer spending. The<br />
average growth rate for the emerging markets for the next five years is 1.9%, compared<br />
to 1.3% for all core markets.<br />
3. Investor Structure<br />
The Fund was launched with four investors on 19 October 2007. One of these was <strong>Commerz</strong><br />
<strong>Real</strong> which placed a strategic investment and provided the necessary equity for the<br />
seed portfolio. The other investors are engaged mostly as real estate investment advisors<br />
or fund-of-fund managers.<br />
The following chart shows the origins of the investors in <strong>CG</strong> <strong>malls</strong> <strong>europe</strong>.<br />
Figure 10: Investor Structure as at 31 December 2009<br />
United Kingdom 10.4 %<br />
Netherlands 31.6 %<br />
Germany 58.0 %
4. Fund Structure<br />
The chart below shows the Fund’s current structure which comprises nine companies<br />
in four countries, and is designed to optimise the interest structure of the seed portfolio<br />
and to provide a perfect basis for future investments.<br />
Fund Structure<br />
<strong>CG</strong>M Lux 2 (L)<br />
Forum Almada<br />
Gestão de Centro Comercial<br />
S.U., Lda. (P)<br />
70%<br />
Forum Almada<br />
Gestão de Centro Comercial<br />
S.U., Lda. II & Comandita (P)<br />
30%<br />
<strong>CG</strong>M Lux 1 (L)<br />
<strong>CG</strong>M Lux 3 (L)<br />
Forum Montijo<br />
Gestão de Centro Comercial<br />
S.U., Lda. (P)<br />
Brafero<br />
Sociedade Imobiliária S.A.<br />
(P)<br />
Management<br />
<strong>CG</strong> NL Holding B.V.<br />
(NL)<br />
Espacio León<br />
PropCo S.L.<br />
(E)<br />
Almada Forum Forum Montijo Espacio León<br />
<strong>CG</strong> <strong>malls</strong> <strong>europe</strong> owns three Luxembourg holding companies, these being <strong>CG</strong>M Lux<br />
1 S.à r.l., which is the top-tier parent company in the holding structure, and its two<br />
Luxembourg subsidiaries, <strong>CG</strong>M Lux 2 S.à r.l. and <strong>CG</strong>M Lux 3 S.à r.l. While the two-tier<br />
approach in Luxembourg is quite common as it allows to sell the whole portfolio at once<br />
by selling the interest of the second-tier company, our approach of having two companies<br />
at the second tier takes the specific structure of the seed portfolio into account. It also<br />
helped to prevent the payment of transfer taxes on the purchase of Almada Forum.<br />
Manager‘s Report on the Fund<br />
<strong>CG</strong> <strong>Real</strong> Estate<br />
Luxembourg<br />
19
20<br />
All three Luxembourg companies are financed through profit-participating loans (PPLs).<br />
The table below shows the respective amounts of these PPLs that are used to procure for<br />
<strong>CG</strong>M Lux 2 S.à r.l. and <strong>CG</strong>M Lux 3 S.à r.l. the funds necessary to acquire the respective<br />
components of the seed portfolio.<br />
Profit Participating Loans<br />
Lender Borrower Amount<br />
<strong>CG</strong> <strong>malls</strong> <strong>europe</strong> <strong>CG</strong>M LUX 1 289,833,402.06<br />
<strong>CG</strong>M LUX 1 <strong>CG</strong>M LUX 2 97,862,982.65<br />
<strong>CG</strong>M LUX 1 <strong>CG</strong>M LUX 3 191,950,419.40<br />
Through these Luxembourg companies, the Fund indirectly owns four Portuguese<br />
companies, one Dutch holding and one Spanish property company. For details on these<br />
companies, see the description of the respective acquisition.<br />
5. Acquisition of Seed Portfolio<br />
On 31 October 2007, the Fund acquired the seed portfolio from another fund managed<br />
by the <strong>Commerz</strong> <strong>Real</strong> Group. The seed portfolio comprises three premium dominant<br />
regional shopping centres that fit the Fund strategy. It consists of Almada Forum and<br />
Forum Montijo, both located south of Lisbon, Portugal, and Espacio León, located in<br />
León in northern Spain. In order to mitigate conflicts of interests arising because seller<br />
and buyer were affiliated companies, a process was designed in which a total of three independent<br />
valuers were commissioned to calculate the market values of each of the three<br />
properties. These valuers were Cushman & Wakefield and DTZ on the one hand and the<br />
independent valuers of the selling fund on the other hand. To ensure transparency and<br />
objectivity, <strong>Commerz</strong> <strong>Real</strong> engaged BDO Deutsche Warentreuhand AG, an audit company<br />
not affiliated with <strong>Commerz</strong> <strong>Real</strong>, to supervise and monitor the valuation process performed<br />
by the three valuers.<br />
The chosen process was a simulation of a tender process or auction – i.e. the process<br />
most likely to be chosen for a third-party transaction – that implied advantages for either<br />
party. The seller benefits from getting the highest price for his assets within a bracket<br />
that reflects the realistic valuations of individual assets. The buyer in turn benefits from<br />
this pricing process since it precludes transaction insecurity and the possible loss of<br />
expenditures connected with primary due diligence analyses.<br />
The subsequent paragraphs provide detailed information on each of the properties, including<br />
the structuring and financing details. For more information about the properties<br />
themselves, please refer to the Property Report section below.
5.1 Almada Forum<br />
Almada Forum is held by Forum Almada – Gestao de Centro Comercial, Sociedade<br />
Unipessoal, Lda. II & Comandita (Almada Cda.). The company has let the entire mall to<br />
Forum Almada – Gestao de Centro Comercial, Sociedade Unipessoal, Lda. (Almada Lda.)<br />
which acts as the operating company and grants use rights for the shops to the respective<br />
tenants.<br />
Almada Lda. was bought by <strong>CG</strong>M Lux 2 S.à r.l., and Almada Lda. subsequently acquired<br />
a 70% interest in Almada Cda. The remaining 30% interest was acquired by <strong>CG</strong>M Lux 3<br />
S.à r.l. As Almada Cda. is a private company, the 70/30-split was necessary to avoid the<br />
payment of a transfer tax.<br />
The current structure of the Almada investment – as well as the overall structure – was<br />
designed with a view to tax efficiency. Therefore the companies were funded both<br />
through external and internal loans. In this specific case, Almada Lda. received three<br />
different types of loan facilities to finance the acquisition of its 70% interest in Almada<br />
Cda.: a EUR 35,800,000 loan facility from Eurohypo Portugal, a EUR 42,663,800 intragroup<br />
loan from Forum Montijo – Gestao de Centro Comercial, Sociedade Unipessoal,<br />
Lda. (Montijo Lda.), the operating company for Forum Montijo, and a EUR 96,844,069.52<br />
shareholder loan from <strong>CG</strong>M Lux 2 S.à r.l. <strong>CG</strong>M Lux 3 S.à r.l. financed the 30% interest in<br />
Almada Cda. through the PPL received from <strong>CG</strong>M Lux 1 S.à r.l.<br />
Financing structure as at 31 December 2009 31 December 2008<br />
Almada Lda. Almada Lda.<br />
Equity -35,705,559.00 -17,546,615.93<br />
Shareholder loan 96,844,069.52 96,844,069.52<br />
Intra-group loan 42,663,800.00 42,663,800.00<br />
Long-term debt 35,800,000.00 35,800,000.00<br />
161,749,306.80 157,761,253.59<br />
The grant of the intra-group loan is explained by the fact that due to Portuguese legal<br />
restrictions – the so-called financial assistance – it is impossible for a borrower to use a<br />
loan secured by an asset owned by a third party to buy – once the loan has been drawn –<br />
this third-party collateral. In order to avoid the issue, the loan granted to Almada Lda. is<br />
secured by Forum Montijo and vice versa. As this construction created excessive external<br />
debt in Montijo Lda. and a deficit in Almada Lda., the missing debt for Almada Lda.<br />
had to be transferred through an intra-group loan.<br />
By 17 November 2009, the market value of Forum Almada Lda. was EUR 333,597,000.00,<br />
appraised by Cushman & Wakefield. This data undercut the value of December 2008<br />
(EUR 357,874,000.00) by EUR 24,277,000.00 (-6,8%).<br />
Manager‘s Report on the Fund<br />
21
22<br />
5.2 Forum Montijo<br />
The acquisition, holding and financing structure used in the case of Forum Montijo<br />
closely resembles the one described for Almada Forum. Therefore, similarities will not<br />
be detailed again below.<br />
Forum Montijo is held by Brafero – Sociedade Imobiliària, S.A. (Brafero S.A.). The company<br />
has let the whole centre to Forum Montijo – Gestao de Centro Comercial, Sociedade<br />
Unipessoal, Lda. (Montijo Lda.) which acts as the operating company and grants use<br />
rights for the shops to the respective tenants.<br />
Montijo Lda. was purchased by <strong>CG</strong>M Lux 3 S.à r.l., and subsequently bought the shares<br />
of Brafero S.A. As Brafero S.A. is a capital company, the acquisition of 100% of the shares<br />
by Montijo Lda. did not trigger any transfer tax payments.<br />
<strong>CG</strong>M Lux 3 S.à r.l. was funded through a PPL from <strong>CG</strong>M Lux 1 S. à r.l. for the acquisition<br />
of Montijo Lda. which received an external loan from Eurohypo Portugal amounting to<br />
EUR 90,670,000.00 and a shareholder loan from <strong>CG</strong>M Lux 3 S. à r.l. amounting to<br />
EUR 69,473,566.83. These funds were used to acquire the shares of Brafero S.A., to<br />
cover expenses connected with the external financing and to grant an intra-group loan<br />
to Almada Lda.<br />
Financing structure as at 31 December 2009 31 December 2008<br />
Montijo Lda. Montijo Lda.<br />
Equity -18,752,558.85 -6,643,006.68<br />
Shareholder Loan 69,473,566.83 69,473,566.83<br />
Intra-Group Loan -42,663,800.00 -42,663,800.00<br />
Long-term Debt 90,670,000.00 90,670,000.00<br />
108,401,355.77 110,836,760.15<br />
By 17 November 2009, the market value for Forum Montijo was EUR 154,481,000.00,<br />
appraised by Cushman & Wakefield. This figure undercuts the value of December 2008<br />
(EUR 164,337,000.00) by EUR 9,856,000.00 (-6.0%).<br />
5.3 Espacio León<br />
The acquisition of Espacio León was an asset deal, in contradistinction to the two<br />
Portuguese share deals. The property was bought by the newly incorporated Spanish Espacio<br />
León PropCo, S.L., (León PropCo). This company is held indirectly by <strong>CG</strong>M Lux 3<br />
S.à r.l. through a Dutch holding company, the <strong>CG</strong> NL Holding B.V. With the incorporation<br />
of the latter the Fund benefits from the existing double tax treaty between the Netherlands<br />
and Spain, which is even more advantageous than the agreement in place between<br />
Luxembourg and Spain.
León PropCo received one long-term loan facility from Eurohypo Spain, amounting<br />
to EUR 61,980,000.00 for the financing of the purchase. León PropCo was capitalized<br />
with a total equity of EUR 11,450,238.95 in 2007 by its shareholder <strong>CG</strong> NL Holding<br />
B.V., which in turn received the required funds for this action by <strong>CG</strong>M Lux 3 S.à r.l.<br />
in the form of equity. In addition, León PropCo was provided with a shareholder loan<br />
over EUR 34,361,156.86 by <strong>CG</strong>M Lux 3 S.à r.l. which was converted into a PPL in April<br />
2010 and was increased by EUR 4,000,000.00 and hence subsequently amounts to<br />
EUR 38,361,156.86. The table below shows the financing sources of the company as at<br />
accounting date:<br />
Financing structure as at 31 December 2009 31 December 2008<br />
Espacio León PropCo Expacio León PropCo<br />
Equity -16,405,443.93 -1,702,719.62<br />
Shareholder loans 34,361,156.86 34,361,156.86<br />
Long-term debt 61,980,000.00 61,980,000.00<br />
79,200,901.46 94,638,437.24<br />
By 17 November 2009, the market value for Espacio León equalled EUR 77,740,000.00,<br />
appraised by the valuation of Cushman & Wakefield. This figure undercuts the value of<br />
December 2008 (EUR 92,254,000.00) by EUR 14,514,000.00 (-15.7%).<br />
6. Development and Performance of the Fund<br />
6.1 Return Figures, in Compliance with Fund GAAP<br />
Having drawn the investors’ capital, the Fund was launched on 26 October 2007. It acquired<br />
the properties described above on 31 October 2007. Therefore, the 2007 financial<br />
year of <strong>CG</strong> <strong>malls</strong> <strong>europe</strong> consisted of just over two months, and – with the exception of<br />
some interest income – there were neither income nor expenses to report before 01 November<br />
2007.<br />
The year 2009 marked the second full financial year after 2008. Like the previous year,<br />
it was defined by the severe real estate and financial crisis. This necessitated substantial<br />
adjustments of the fair market values of the properties in 2009. Following depreciations<br />
totalling EUR 42.3 million in 2008, another EUR 48.6 million worth of impairments had<br />
to be posted in 2009. This means that the portfolio value decreased by altogether 13.8%<br />
since September 2007. Depreciations of this magnitude also negatively impacted the<br />
overall performance of 2009 (-13.1%). Notwithstanding the altogether successful followup<br />
lettings in Montijo and León, the gross rental income slightly decreased to EUR 44.1<br />
million (down from EUR 44.5 million in 2008). Particularly the increasing number of<br />
discounts / bonifications, but also the decline in sales on the tenant side, pushed the base<br />
rent down by EUR 0.5 million and the turnover rent down by EUR 0.3 million.<br />
Manager‘s Report on the Fund<br />
23
24<br />
The following list shows the performance key figures basing on Funds-GAAP for the<br />
whole year 2009.<br />
Fund GAAP Return Figures for 2009<br />
<strong>Real</strong> estate return figures<br />
Almada Montijo León Total<br />
Current market value<br />
(Nov. 2009) 333,597,000 154,481,000 77,740,000 565,818,000<br />
Gross income 9.2% 9.9% 13.6% 10.0%<br />
Management costs -3.1% -4.2% -6.4% -4.5%<br />
Net income 6.1% 5.7% 7.2% 5.5%<br />
Reappraisals -7.3% -6.4% -18.7% -8.6%<br />
<strong>Real</strong> estate result -1.2% -0.6% -11.5% -3.1%<br />
Foreign income taxes 0.0% 0.0% -0.0% -0.2%<br />
Result before loan expenditures -1.2% -0.6% -11.5% -3.2%<br />
Loan expenditures -2.6% -5.0% -4.2% -3.5%<br />
Result after loan expenditures -3.8% -5.7% -15.7% -6.7%<br />
Equity return figures<br />
Initial equity invested<br />
(Oct. 2007) 172,692,717 71,284,051 45,814,876 290,000,000<br />
Result after loan expenditures -7.3% -12.2% -26.6% -13.1%<br />
Average fixed equity (2009) 139,702,913 56,775,784 25,307,075 232,016,005<br />
Result after loan expenditures -9.0% -15.4% -48.1% -16.4%<br />
6.2 Adjusted Return Figures<br />
In the following schedule, the performance key figures are adjusted to reflect a more realistic<br />
point of view when presenting the real estate performance of the shopping center.<br />
The scheme does not include the service charges.
Adjusted Return Figures for 2009<br />
<strong>Real</strong> estate return figures<br />
Almada Montijo León Total<br />
Current market value<br />
(Nov. 2009) 333,597,000 154,481,000 77,740,000 565,818,000<br />
Gross income 7.5% 1) 7.7% 1,2) 9.9% 1) 7.9%<br />
Management costs -1.4% 1) -2.0% 1) -2.7% 1) -2.4%<br />
Net income 6.1% 5.7% 7.2% 5.5%<br />
Reappraisals -7.3% 3) -6.4% -18.7% -8.6%<br />
<strong>Real</strong> estate result -1.2% -0.6% -11.5% -3.1%<br />
Foreign income taxes -0.2% 3,4) -0.2% 3) 0.0% -0.2%<br />
Result before loan expenditures -1.4% -0.8% -11.5% -3.2%<br />
Loan expenditures -3.1% 2) -3.9% 2) -4.2% -3.5%<br />
Result after loan expenditures 5) -4.5% -4.7% -15.7% -6.7%<br />
Equity return figures<br />
Initial equity invested<br />
(Oct. 2007) 172,692,717 71,284,051 45,814,876 290,000,000<br />
Result after loan expenditures 8.6% -10.2% -26.6% -13.1%<br />
Result after loan expenditures<br />
without reappraisals 6) 5.4% 3.6% 5.1% 3.7%<br />
Income return 7) 5.8% 4.2% 6.0% 4.2%<br />
Distributable result 8) 5.5% 3.9% 5.3% 3.8%<br />
Average fixed equity (2009) 139,702,913 56,775,784 25,307,075 232,016,005<br />
Result after loan expenditures -10.7% -12.8% -48.1% -16.4%<br />
Result after loan expenditures<br />
without reappraisals 6.7% 4.6% 9.2% 4.6%<br />
Income return 7.2% 5.3% 10.8% 5.2%<br />
Distributable result 6.7% 5.0% 9.6% 4.8%<br />
1) All objects: not including service and management charges paid by tenants<br />
2) Interest of intra-group loan (EUR 1,728,594.96) enlarges loan expenditures in Almada and reduces it in Montijo as well the<br />
(interest-)income in Montijo<br />
3) Almada: Withholding Tax (EUR 355,935.58 in 2009); Montijo: Withholding Tax (EUR 255,339.48 in 2009)<br />
4) Almada Cda.: Income tax on profit distribution to <strong>CG</strong>M Lux 3 (EUR 255,709.02 in 2009)<br />
5) Result after loan expenditure is the Fund-GAAP profit/loss for the period<br />
6) Result after loan expenditure without reappraisals is the Fund-GAAP profit/loss for the period without changes in the values<br />
of the properties<br />
7) Income return is the result after loan expenditure without reappraisals and without results form investment phase (accruals<br />
for loans from hausInvest fund, amortisation of key money from hausInvest fund in Portugal and pursuit costs in Spain)<br />
8) Distributable result is the income return without amortisation of finance fees in Spain plus cash-flows of key money but<br />
without accruals for key money<br />
Manager‘s Report on the Fund<br />
25
26<br />
6.2.1 Service and Management Charges<br />
Service and management charges paid by the tenants include revenues on the one hand,<br />
and expsenses on the other hand. In most cases, these charges are posted in the financial<br />
accounts of the property companies. In some cases, the tenants pay these charges<br />
into a separate account of the centre management companies where these charges are<br />
cleared. In these cases, the charges are not covered by the accounting of the property<br />
companies. To ensure the comparability of all assets, charges are not reflected in the<br />
adjusted return figures.<br />
6.2.2 Intra-Group Loan<br />
The loan over EUR 90.7 million that was taken out by Montijo Lda. has in part<br />
(EUR 42.7 million) been passed on to Almada Lda. in the form of a so-called intra-group<br />
loan. The interest expenditures shouldered by Montijo Lda. are offset by the interest income<br />
for the intragroup loan as component of the gross income. On the Almada Lda. side,<br />
the interest payments are posted as loan expenditures under expenses. The Fund’s GAAP<br />
figures have been deconsolidated to exclude the interest income in the case of Montijo<br />
Lda. and to exclude the interest expenses of Almada Lda. To ensure comparability, the<br />
deconsolidated interest expense was posted as interest expense for Almada Lda. again,<br />
while the interest income was posted as “negative” loan expenditure for Montijo Lda.<br />
6.2.3 Withholding Tax on Interets for Shareholder Loan in Portugal<br />
The Portuguese inland revenue service retained 15% – or 5% as at 01 July 2009 – in<br />
withholding tax on the shareholder loan interest that Almada Lda and Montijo Lda pay to<br />
<strong>CG</strong>M Lux 2 and <strong>CG</strong>M Lux 3. The payors of the withholding tax are <strong>CG</strong>M Lux 2 and <strong>CG</strong>M<br />
Lux 3, respectively. In 2007 and 2008, these payments were posted in the performance<br />
account as tax debt of the fund companies (<strong>CG</strong>M Lux 2 and <strong>CG</strong>M Lux 3). In order to trace<br />
the expenditures connected to the ownership of property interests with more precision,<br />
the Fund Management decided to attribute the withholding tax dues to the respective<br />
property interest whose structure or activities incurred them. In 2009, withholding taxes<br />
on shareholder loan interest amounted to EUR 355,935.58 in the case of Almada and to<br />
EUR 255,339.48 in the case of Montijo.<br />
6.2.4 Income Tax on the Income Distribution of Almada Cda.<br />
<strong>CG</strong>M Lux 3 in Portugal will have to remit 26.5% in income tax on the income distribution<br />
that Almada Cda. pays out to <strong>CG</strong>M Lux 3 because of the 30% interest held by the<br />
latter. Payor of this income tax is <strong>CG</strong>M Lux 3. In 2007 and 2008, these payments were<br />
posted in the performance account as tax debt of the <strong>CG</strong>M Lux 3 fund company. In order<br />
to trace the expenditures connected to the ownership of property interests with more<br />
precision, the Fund Management decided to attribute the income tax dues to the respective<br />
property interest whose structure or activities incurred them. In 2009, an income<br />
tax debt totalling EUR 255,709.02 was due for the distribution of Almada Cda.
6.3 Distribution<br />
According to the above calculations, the earned returns (income returns) for 2009<br />
without the depreciations on the value of the shopping centres would amount to approx.<br />
3.8%. With a view to the ongoing negotiations with several new tenants who have made<br />
their decision to open a new business in the shopping <strong>malls</strong> dependent on the payment of<br />
a fit-out contribution by the owner, the Fund Management decided to set aside provisions<br />
toward this end, and to reduce the amount distributed to the investors to 3.25% per<br />
share. The distribution equals a 4.06% cash-on-cash return on the average fixed equity<br />
for 2009. The amount distributed will be paid on 19 July 2010.<br />
Total distribution in EUR 9,425,000.00<br />
per share in EUR 3.25<br />
Cash-on-cash return on initial equity invested 3.25%<br />
Cash-on-cash return on average fixed equity 4.06%<br />
6.4 Future Developments<br />
As expected, the financial crisis did escalate into an economic crisis. During the opening<br />
months of 2010, the crisis moreover expanded to impact the weaker Eurozone member<br />
states as well. The national governments of the affected countries intend to address<br />
the crisis with – in some cases – extensive austerity measures.<br />
We assume that these austerity measures will have ramifications for the consumer<br />
behaviour in Portugal and Spain. This will in turn impact sales at our shopping centres.<br />
As a result, it is safe to expect that tenants will approach us with additional requests for<br />
bonifications and discounts. It is equally likely to affect upcoming lease negotiations in<br />
2010. We therefore project a slightly lower rental income compared to the previous year.<br />
That said, we intend to counter this possible trend by stepping up our letting efforts. To<br />
facilitate the lease negotiations with suitable tenants we should cover the fit-out costs for<br />
shops they intend to open. Some of the cash flow not distributed will be earmarked for<br />
this purpose.<br />
Then again, investor interest in Spain appears to revive. Increased investment activities<br />
in these countries would precipitate a decline in yield rates and thereby bolster real<br />
estate values. One of our priorities remains to boost the competitiveness of the shopping<br />
<strong>malls</strong>. Accordingly, we will undertake various face-lifting measures that will upgrade the<br />
outer appearance of the <strong>malls</strong>.<br />
Manager‘s Report on the Fund<br />
27
28<br />
Property Report<br />
1. Portfolio Overview<br />
<strong>CG</strong> <strong>malls</strong> <strong>europe</strong> started building up a diversified cross-European portfolio by acquiring three premium dominant regional<br />
shopping centres of premium quality. These <strong>malls</strong>, two of which are located in Lisbon/Portugal and one of which is<br />
located in León/ Spain, represents the Fund’s so-called seed portfolio.<br />
The following tables provide a brief summary of the seed portfolio’s metrics:<br />
Property information Almada Forum Espacio<br />
as at 31 December 2009 Forum Montijo León Total<br />
Type of asset Shopping Center Shopping Center Shopping Center<br />
Country Portugal Portugal Spain<br />
City / greater area Lisbon Lisbon León<br />
Adress Estrada do Caminho Zona Industrial do Avenida del<br />
Municipal 1011 Pau Queimada País Leonés n° 12<br />
Vale de Mourelos Rua da Azinheira –<br />
Afonseiro<br />
2810-354 Almada 2870-100 Montijo 24010 León<br />
Construction date 2002 2003 2004<br />
Acquistion date 31 Oct. 2007 31 Oct. 2007 31 Oct. 2007<br />
Site area (sqm) 197,888 198,638 29,946 426,472<br />
Total GLA (sqm) 81,400 58,200 36,500 176,100<br />
Thereof hypermarket (sqm) 21,900 17,500 0 39,400<br />
GLA without hypermarket<br />
- Ownership of the fund - (sqm) 59,500 40,700 36,500 136,700<br />
Ownership in % 100% 100% 100%<br />
Parking spaces 5,253 3,900 1,339 10,492<br />
No. of shops 253 163 113 529<br />
Purchase price of the properties<br />
(Oct. 2007 in million EUR) 381.3 171.7 104.0 657.0<br />
Initial market value of the properties<br />
(Oct. 2007 in million EUR) 381.3 171.7 103.8 656.8<br />
Market value of the properties<br />
(June 2009 in million EUR) 344.7 158.0 80.0 582.7<br />
Current market value of the properties<br />
(Nov. 2009 in million EUR) 333.6 154.5 77.7 565.8<br />
Current cap rate<br />
(Nov. 2009 in %) 6.55% 6.65% 7.50%
Funds Total<br />
Initial equity invested<br />
(Oct. 2007 in million EUR) 172.7 71,3 45.8 0.2 290.0<br />
Current equity invested<br />
(Dec. 2009 in million EUR) 127.0 50.7 18.0 11.5 207.2<br />
Property Report<br />
Property information Almada Forum Espacio<br />
1 Jan 2009 – 31 Dec 2009 Forum Montijo León Total<br />
Sales (million EUR) 209.9 116.1 79.5 405.5<br />
Footfall (million) 15.4 8.6 4.7 28.7<br />
Effort index 13% 11% 11% 12%<br />
Espacio León<br />
29
30<br />
Tenancy information Almada Forum Espacio<br />
as at 31 December 2009 Forum Montijo León Total<br />
Base rent (million EUR) 23.0 10.3 7.1 40.4<br />
Turnover rent (million EUR) 0.4 0.5 0.3 1.2<br />
Mall income (million EUR) 0.3 0.3 0.2 0.8<br />
Other rental income (million EUR) 1.2 0.5 0.0 1.7<br />
Gross rental income (million EUR) 24.9 11.6 7.6 44.1<br />
Average lease duration in years 5.3 5.8 7.3 5.8<br />
Lease expiry in the next<br />
2 years in % of total base rent 6.1% 9.2% 15.5% 8.5%<br />
Lease expiry in the next<br />
3 years in % of total base rent 22.7% 11.2% 30.0% 21.0%<br />
Top 10 tenants in income<br />
(million EUR) 4.6 3.0 2.7 7.6<br />
Top 10 tenants<br />
in % base rent 20.0% 29.6% 39.3% 19.0%<br />
Top 10 tenants duration<br />
in years 6.5 7.8 12.3 8.7<br />
Vacancy rate sqm 3.8% 5.6% 5.3% 4.8%<br />
Vacancy rate sqm without<br />
rent guarantee 3.8% 6.3% 7.1% 5.4%<br />
Vacancy rate income 3.4% 4.8% 3.4% 3.8%<br />
Vacancy rate income without<br />
rent guarantee 3.4% 6.5% 10.9% 5.5%<br />
Vacant rental units 9 6 10 25<br />
Vacant rental units without<br />
rent guarantee 9 7 15 31
The vacancy rate is reported in relation to the let floor space (sqm) and to the rental<br />
income (base rent) to be realised. Since Multi Development, the developer and purchaser<br />
of the <strong>malls</strong>, is paying rent guarantees, additional vacancy rates were posted which<br />
would result from a termination of the rent guarantee. In Montijo, rent guarantee payments<br />
were made for a vacant space and for a let space (to offset the difference between<br />
the contractually agreed rent and the rent actually paid by the tenant) as at 31 December<br />
2009. In Léon, rent guarantee payments were made for five vacant retail units and<br />
for seven let units as at 31 December 2009. Difficult as it was, the year 2009 did see the<br />
successful extension of 17.5% of all portfolio leases (in terms of rental income). Almada<br />
accounted for 7.5%, Montijo for 37.5% and León for 20.3% of these lease renewals.<br />
Regrettably, it proved impossible to re-let all of the floor space. The number of rent<br />
discounts granted to tenants also went up in 2009. Tenants requested rent-free period<br />
less often than they did discounts / bonifications on the existing rent level. In Almada,<br />
we granted rent-free periods to a total of 6 tenants and discounts / bonifications to a total<br />
of 50 tenants in 2009. In Montijo, we granted rent-free periods to 9 tenants and discounts<br />
/ bonifications to 26 tenants in 2009. In León, finally, we granted rent-free periods to 5<br />
tenants and discounts / bonifications to 25 tenants in 2009.<br />
The following chart and table show the portfolio’s lease expiration profile for the future:<br />
Lease Expiration in % of total rental income<br />
Lease Expiration in % of Total Rental Income as at 31 December 2009<br />
40%<br />
35%<br />
30%<br />
25%<br />
20%<br />
32.1%<br />
15%<br />
10%<br />
5%<br />
4.4% 4.1%<br />
12.4%<br />
6.0%<br />
14.1%<br />
1.4%<br />
4.9% 5.8%<br />
3.4%<br />
11.4%<br />
0%<br />
2010 2011 2012 2013 2014 2015 2016 2017 2018 2019 2020+<br />
2009 2010 2011 2012 2013 2014 2015 2016 2017 2018 2019+<br />
In the wake of the massive reletting activities in Almada (2008), Montijo (2009) and León<br />
(2009), the lease expiration profile has completely changed. The percentage of expiring<br />
leases in relation to the base rent over the next three years equalled 20.9% by 31<br />
December 2009, and is significant lower compared to the terms of 2008 and 2009. Due<br />
to the customarily six-year lease terms in Portugal and the customary five-year lease<br />
terms in Spain, the next wave of letting activities is to be expected for 2014 (Almada and<br />
León) and 2015 (Montijo). These extensive new lettings are likely to offer opportunities<br />
for reshuffling the existing sector and tenant roster once the economic environment<br />
improves. In addition, it is also a chance to adjust the agreed base rent whenever appropriate<br />
and – in case of the Portuguese properties – to collect extra cash and future income<br />
through key money and renewal fee payments.<br />
Property Report<br />
Year of Expiration in %<br />
2010 4.4%<br />
2011 4.1%<br />
2012 12.4%<br />
2013 6.0%<br />
2014 32.1%<br />
2015 14.1%<br />
2016 1.4%<br />
2017 4.9%<br />
2018 5.8%<br />
2019 3.4%<br />
2020+ 11.4%<br />
100.0%<br />
31
32<br />
The following table shows the top ten portfolio tenants in terms of rental income by<br />
31 December 2009. Several tenants rented units at all three <strong>malls</strong>, and in these cases the<br />
sum totals are posted:<br />
Name Area Branch End of Term Centre<br />
ZARA 6,833 sqm Fashion 09/2017 Almada Forum<br />
04/2018 Forum Montijo<br />
10/2024 Espacio León<br />
LUSOMUNDO<br />
Home equipment 01/2021 Almada Forum<br />
CINEMA 8,180 sqm Leisure 09/2022 Almada Forum<br />
04/2023 Forum Montijo<br />
C&A 3,861 sqm Fashion 09/2012 Almada Forum<br />
11/2014 Forum Montijo<br />
HENNES &<br />
MAURITZ 3.970 sqm Fashion 09/2021 Almada Forum<br />
04/2018 Forum Montijo<br />
10/2024 Espacio León<br />
CINEBOX 4,000 sqm Leisure 10/2019 Espacio León<br />
FNAC 2,499 sqm Leisure 10/2012 Almada Forum<br />
MEDIAMARKT 3,470 sqm Home equipment 10/2019 Espacio León<br />
BERSHKA 1,679 sqm Fashion 01/2021 Almada Forum<br />
04/2018 Forum Montijo<br />
10/2024 Espacio León<br />
TOYS “R” US 2,138 sqm Leisure 09/2014 Almada Forum<br />
MASSIMO DUTTI 1,559 sqm Fashion 09/2017 Almada Forum<br />
04/2018 Forum Montijo<br />
10/2024 Espacio León
2. Almada Forum<br />
Almada Forum is a prime shopping centre located in the Portuguese city of Almada,<br />
which lies directly south of Lisbon, separated from the Portuguese capital only by the<br />
delta of the river Tagus. Both municipalities are connected through the “25th of April”<br />
Bridge which carries a significant part of the commuter traffic into Lisbon, an estimated<br />
total of nearly one million per day. The centre itself is visible both from the southbound<br />
highway out of Lisbon and from the road connecting Almada with the coastal areas. It<br />
is easy to reach by car via exits from either road. Pragal, near the location of the centre,<br />
has a train station with direct connections to Lisbon. The mall has become the new<br />
centre of Almada. With its scenic setting, Almada Forum offers visitors a magnificent<br />
panoramic view, 1300 metres of track that connects Almada Forum with Parque da Paz,<br />
the main square of Almada, and that is suitable for running and cycling.<br />
The mall is one of the largest in Portugal, offering approximately 81,400 sqm of retail<br />
space on three levels that include a hypermarket, leisure venues, a restaurant and food<br />
court. While giving Almada a new urban centre, the mall complements the town’s identity,<br />
as a touch of “local colour” emanates from a variety of themes used in the design of<br />
the three squares of the mall, the use of local materials and the decoration of the centre<br />
with works by regional artists. The success of this concept was confirmed by a number of<br />
prestigious awards the mall has won since it opened – one of those being the Full Design<br />
and Development Award in 2004. It is the world’s most coveted award for shopping centre<br />
design, and Almada Forum won against entries from USA, Japan, Korea, Spain and<br />
Ecuador. Almada Forum also obtained the Management Environmental Certification (NP<br />
EN ISO 14.001) in 2004.<br />
Almada Forum opened in 2002, and has offered an attractive branch and tenant mix on<br />
55,500 sqm of retail space ever since. In December 2005, a stand-alone annex for another<br />
three shops and a total area of 4000 sqm opened for business. The location has also<br />
gained in attraction for other investors, such as Leroy Merlin and Decathlon.<br />
Property Report<br />
Almada Forum<br />
33
34<br />
Almada Forum<br />
As at 31 December 2009, the top 10 tenants in terms of annual rental income were (sorted<br />
by floor space):<br />
Name<br />
LUSOMUNDO<br />
Floor space Branch End of Term<br />
CINEMA 5,610 sqm Leisure 09/2022<br />
FNAC 2,499 sqm Leisure 10/2012<br />
ZARA 2,220 sqm Fashion 09/2017<br />
C&A 2,204 sqm Fashion 09/2012<br />
JUMBO NATUREZA 2,174 sqm Services 08/2017<br />
TOYS R US 2,138 sqm Leisure 09/2014<br />
SPORTZONE 1,163 sqm Leisure 09/2014<br />
CORTEFIEL 1,013 sqm Fashion 09/2017<br />
ZIPPY 723 sqm Fashion 09/2012<br />
A LOJA DO GATO<br />
PRETO 445 sqm Home Equipment 09/2014<br />
The shopping centre is home to a total of over 250 shops, including a jumbo hypermarket<br />
of 21,900 sqm owned by CPH (Auchan Group). The hypermarket is located on the ground<br />
floor, together with shops for children’s fashion, sporting goods, electronics, home<br />
decoration and furnishings, as well as book stores, record stores, toy stores, any many<br />
more. The anchor tenants in the fashion and accessories segment are located on the first<br />
floor. A cinema of 14 screens – the most successful multiplex venue nationwide – and the<br />
mall’s food court with 35 restaurants is located on the second floor. The average remaining<br />
lease term at the mall was 5.3 years by 31 December 2009 (on the basis of remaining<br />
lease term per unit, weighted by rental income per unit).
The following table and chart show the lease expiration profile for the Almada Forum:<br />
Almada Lease Expiration in % of total rental income<br />
Almada Lease Expiration in % of Total Rental Income as at 31 December 2009<br />
45%<br />
40%<br />
35%<br />
30%<br />
25%<br />
44.4%<br />
20%<br />
16.6%<br />
15%<br />
10%<br />
5%<br />
0%<br />
4.0%<br />
2010<br />
2.1%<br />
2011 2012<br />
4.7%<br />
2013 2014<br />
6.6%<br />
2015<br />
1.3%<br />
2016<br />
8.1%<br />
2017<br />
1.1%<br />
2018<br />
0.5%<br />
2019<br />
10.6%<br />
2020+<br />
2009 2010 2011 2012 2013 2014 2015 2016 2017 2018 2019+<br />
By 31 December 2009, the mall’s vacancy rate equalled 3.8 %; with nine shops being<br />
vacant. The biggest unit on the mall’s second floor, totalling 1,973 sqm (3.3 % of the<br />
rental area) has been successfully relet to Specialized since 01 Augsut 2009. It is Specialized<br />
biggest shop in Europe. Nespresso opened its branch in Summer 2009. As most<br />
shoppers travel to Almada Forum by car the center offer more than 5,000 free parking<br />
spaces on two levels to accommodate motorists even at peak times. The following charts<br />
show the floor plans of the mall:<br />
Almada floor plans<br />
Shops by group of activity - level 0<br />
Fashion Hypermarket Restaurant<br />
Home equipment Personal Accessoires Services<br />
Leisure Others<br />
Property Report<br />
Year of Expiration in %<br />
2010 4.0%<br />
2011 2.1%<br />
2012 16.6%<br />
2013 4.7%<br />
2014 44.4%<br />
2015 6.6%<br />
2016 1.3%<br />
2017 8.1%<br />
2018 1.1%<br />
2019 0.5%<br />
2020+ 10.6%<br />
100.0%<br />
35
36<br />
Shops by group of activity - level 1<br />
Fashion Restaurant Home equipment<br />
Personal Accessoires Services Leisure<br />
Shops by group of activity - level 2<br />
Restaurant Leisure<br />
Shops by group of activity - Stand Alone<br />
Home equipment Services
The location and accessibility of the mall ensure a constant footfall. The mall is open<br />
seven days a week, year round. According to the official Portuguese census figures from<br />
2001, approx. 440,000 people live within a catchment area of a 15-minute commute, with<br />
another 1,600,000 residents living within a catchment area of a 15- to 30-minute commute.<br />
Overall, more than 2 million potential consumers are able to get to the centre within<br />
30 minutes. This is reflected in the 15.4 million customers who visited Almada Forum in<br />
2009. Forecasts have predicted positive demographic growth for the area.<br />
Almada Forum Catchment Area<br />
Primary catchment<br />
Secondary catchment<br />
Source: www.viamichelin.de<br />
LISBOA<br />
Almada<br />
Almada Forum<br />
Seixal<br />
Rio Tejo<br />
Sesimbra<br />
Montijo<br />
Rio Tejo<br />
Barreiro<br />
Alcochete<br />
Pinhal Novo<br />
Palmela<br />
According to the figures for 2006 published by INE (EPCC 2005 Estudo do Poder de<br />
Compra Concelhio), the purchasing power index for Almada, where the mall is located,<br />
equals 128, the reference index value being the Portuguese national average (100). In<br />
general, the purchasing power of the entire Lisbon area lies far above the average. In<br />
2009, sales at the Almada Forum amounted to EUR 210 million, which translates into to<br />
a turnover per sqm of approximately EUR 4,000 annually. The centre generated a rental<br />
income of approximately EUR 23.7 million in 2009, including base rent, turnover rent<br />
and revenues from temporary lettings (mall income). Simultaneously, the 2009 effort<br />
index (rent/sales ratio) for the tenants had a level of 13% on average.<br />
Competition amongst shopping centres in Portugal, especially in Lisbon, is fierce. The<br />
major competitors of Almada Forum are the “Centro Colombo” with a gross lettable area<br />
(GLA) of around 120,000 sqm, and “Centro Vasco da Gama” with a GLA of approximately<br />
48,000 sqm. With the new centre “Dolce Vita Tejo” (opened in May 2009) and its GLA of<br />
more than 120,000 sqm, another potent competitor has entered the market. All three of<br />
Moita<br />
Quinta do Conde<br />
Lisboa<br />
Setúbal<br />
Property Report<br />
37
38<br />
Almada Forum<br />
these <strong>malls</strong> are located within the Lisbon city limits, north of the river Tagus. Almada<br />
Forum has developed over time into a well-known shopping destination of supra-regional<br />
importance and offers a very high standard to the public. The branch and tenant mix is<br />
continuously adapted to the changing retail landscape. In addition, its catchment area<br />
is located south of the Tagus delta. The secondary catchment areas of Almada Forum<br />
and Forum Montijo overlap slightly. However, the competition between the two centres<br />
remains low. The Almada Forum has the sustainable capacity to compete with the large<br />
volume of retail schemes in the Lisbon area.<br />
Almada Forum has already attained a high market penetration. The scheme is a stabilized<br />
asset, generating stable and moderately increasing rental income at a high productivity<br />
level (turnover/sqm sales area). The ongoing improvement of the mall’s surroundings<br />
(e.g. complementary retail park, Decathlon flagship store, Leroy Merlin) supports<br />
the establishment of the site as a prime location for shopping. Future potential for rental<br />
growth can be derived from increased consumer spending as the catchment area is penetrated<br />
more deeply over time by centre management’s marketing activities.
3. Forum Montijo<br />
Forum Montijo is located on the Portuguese Setubal Peninsula – representing the south<br />
bank of the river Tagus southeast of Lisbon – at one of the access roads to the town of<br />
Montijo. Since the construction of the Vasco da Gama Bridge, Lisbon’s second bridge<br />
over the river Tagus and with a total length of 17.2 km the longest bridge in Europe, the<br />
greater Lisbon south bank has seen an enormous population growth. The proximity to<br />
the new bridge, which was built for the world fair Expo 98 together with an excellent<br />
new road infrastructure, has made the city of Montijo and its surroundings a compulsory<br />
throughway of both regional and national importance. Due to the new bridge, the<br />
economic base of this area has changed and is expected to improve further, providing<br />
the opportunity to expand the catchment area of the shopping centre. The demographic<br />
structure of the region has also significantly changed. New target groups with higher<br />
disposable income can now be addressed, as more people working in Lisbon and belonging<br />
to higher income brackets have recently moved to the aforementioned region, thereby<br />
increasing the economic as well as the purchasing power. Once a rural backwater, the<br />
area’s new accessibility has given Montijo the potential to become Lisbon’s most densely<br />
populated southern suburb after Almada.<br />
Forum Montijo opened for the public in 2003. Inspired by the region’s rural past, the<br />
architecture of the shopping centre is based on the impressive farmstead characteristics<br />
of the area. The idea was to build an out-of-town regional shopping centre with three<br />
specific retail elements: a 30,700 sqm two-level shopping centre connected to a Continente<br />
hypermarket of additional 17,500 sqm which is owned by the chain itself, together<br />
with a 10,000 sqm stand-alone retail park. The whole area is served by 3,900 landscaped<br />
surface-level parking spaces. The centre is very close to the main roads leading south<br />
(Setubal) and southwest (Coina) plus highway A12, linking the northern and southern<br />
motorways via Vasco da Gama Bridge. Therefore, Forum Montijo is easily accessed from<br />
any direction of the catchment area. The mall houses 158 shops/rental units, including<br />
six anchor stores, a food court comprising 24 restaurants, a state-of-the-art cinema with<br />
six screens and a Continente hypermarket.<br />
Property Report<br />
Forum Monijo<br />
39
40<br />
Located next to the main entrance of the mall is a stand-alone retail park that includes<br />
five large shop units. The top 10 tenants in terms of annual rental income as at 31 December<br />
2009 are (sorted by floor space):<br />
Name Area Sector End of term<br />
IZI<br />
LUSOMUNDO<br />
3,000 sqm Home equipment 04/2018<br />
CINEMA 2,570 sqm Leisure 04/2023<br />
BABOU 2,326 sqm Home equipment 04/2013<br />
ZARA 2,261 sqm Fashion 04/2018<br />
DECATHLON 1,911 sqm Leisure 04/2023<br />
C&A 1,657 sqm Fashion 11/2014<br />
RADIO POPULAR 1,620 sqm Leisure 04/2013<br />
HENNES &<br />
MAURITZ 1,396 sqm Fashion 04/2018<br />
NORAUTO 1,171 sqm Services 04/2018<br />
SPORTZONE 872 sqm Leisure 04/2015<br />
Source: <strong>Commerz</strong> <strong>Real</strong> Group<br />
On the ground floor near the dome-shaped main entrance there are mainly book stores<br />
and other media and furniture stores. The mall on the ground floor hosts primarily fashion<br />
and accessories stores, as does the opposite, rectangular end of the centre. Parallel<br />
to the mall midway is another, smaller mall with the entrance to the hypermarket at one<br />
side and smaller shops, offering miscellaneous goods and services, on the other side.<br />
The shopping centre’s food court is located on the first floor above the main entrance.<br />
The rest of the first floor is almost exclusively arranged for fashion stores, with the entrance<br />
to the cinema located in the heart of the mall. The shops located in the retail park<br />
offer building material, furniture and decoration, automotive services, electronic goods<br />
and sporting goods.<br />
By the end of December 2009, the shopping centre reported six vacant units, resulting in<br />
a vacancy rate of 5.6%. The average remaining lease term was 5.8 years as at 31 December<br />
2009 (on the basis of remaining lease term per unit, weighted by rental income per<br />
unit). The following table and chart show the mall’s lease expiration profile:
Montijo Lease Expiration in % of total rental income<br />
Montijo Lease Expiration in % of Total Rental Income as at 31 December 2009<br />
45%<br />
40%<br />
35%<br />
30%<br />
39.5%<br />
25%<br />
20%<br />
20.1%<br />
15%<br />
12.3%<br />
10%<br />
5%<br />
0%<br />
4.5%<br />
2010<br />
4.8%<br />
2011<br />
2.0%<br />
2012 2013<br />
7.7%<br />
2014 2015<br />
0.5%<br />
2016<br />
0.8%<br />
2017 2018<br />
0.6%<br />
2019<br />
7.3%<br />
2020+<br />
2009 2010 2011 2012 2013 2014 2015 2016 2017 2018 2019+<br />
Forum Montijo floor plans<br />
Tiosi<br />
Shops by group of activity - first floor<br />
Fashion Restaurant<br />
Personal Accessoires Leisure<br />
Property Report<br />
Year of Expiration in %<br />
2010 4.5%<br />
2011 4.8%<br />
2012 2.0%<br />
2013 12.3%<br />
2014 7.7%<br />
2015 39.5%<br />
2016 0.5%<br />
2017 0.8%<br />
2018 20.1%<br />
2019 0.6%<br />
2020+ 7.3%<br />
100.0%<br />
41
42<br />
Shops by group of activity - Ground Floor<br />
Fashion Restaurant Home equipment<br />
Personal Accessoires<br />
Hypermarket<br />
Services Leisure<br />
Shops by group of activity - Retail Park<br />
Home equipment Services Leisure<br />
Forum Montijo has an attractive, fast-growing catchment area that is home to about<br />
130,000 people within a 10-minute commute. The secondary catchment area inside a driving<br />
time of 30 minutes includes another 655,000 residents, adding up to a total of about<br />
785,000 people. In 2009, more than 8.6 million customers visited the mall, which reflects
an increase of three percent to 2008. Polls show that 59% of the customers of Forum<br />
Montijo are young (under 34 years), and that many of these are families. Taking this into<br />
account, the centre management has provided several free services such as an indoor<br />
and an outdoor playground and a place where children can play with piles of Lego. The<br />
food court makes microwaves available to families as well as feeding bottle heaters<br />
and highchairs. In addition, the centre management set up the so-called Friendship<br />
Recycling Centre, where visitors may donate clothes, shoes, toys, and other items to be<br />
passed on to charity groups for children. This project won in 2008 an ICSC (International<br />
Council of Shopping Centers) Silver Solal Award in the “Community Relations” category.<br />
All of these measures are designed to enhance the popularity of Forum Montijo and its<br />
acceptance throughout the catchment area. The fact that 40% of the visitors come to the<br />
centre every weekend demonstrates the success of the overall concept.<br />
The purchasing power of the population inside the catchment area (Setubal Peninsula)<br />
is 115.67, the reference index being a Portuguese national average of 100. Sales in 2009<br />
amounted to EUR 116 million, which translates into a turnover per sqm of approximately<br />
EUR 3,300 and sales per customer of more than EUR 13.44. The total rental income<br />
(including base rent, turnover rent, and income from temporary lettings) in 2009 was approximately<br />
EUR 11.1 million. The effort index (rent/sales ratio) for the tenants equalled<br />
just 11% on average.<br />
In general, Forum Montijo has the same competitors as Almada Forum, all of which are<br />
located on the north bank of the river in Lisbon. The catchment area of Forum Montijo<br />
overlaps almost nowhere with those of the other major players in the region. Customers<br />
of Forum Montijo named the Freeport Designer Outlet in polls when asked about other<br />
shopping centres they visit. As Freeport, located northeast of Forum Montijo, has a<br />
totally different concept, being an outlet centre, there is no direct competition between<br />
the two schemes. In fact, there is an overlap in the secondary catchment areas of Almada<br />
Forum and Forum Montijo. The competition between the two centres is therefore inherent<br />
but negligible.<br />
Forum Montijo was the first shopping centre in Europe to obtain an environmental<br />
certificate – ISO 14001. The International Standards Award 14001 requires strict compliance<br />
with environmental recommendations. The standards and procedures include<br />
safe disposal of all waste products at the mall, monitoring and control of noise levels,<br />
and protection of air quality. In addition, energy saving measures are also taken into<br />
account. In 2008, Forum Montijo also won an ICSC Silver Solal Marketing Award with it’s<br />
Magic Lamp Project. The campaign was focused around the Christmas skating rink and<br />
showcased the strong ties to the community. The „Magic Lamp“ Project was based on<br />
the three mainstays of sustainable development: the environmental, the economic, and<br />
the social aspect.<br />
In 2009, Forum Montijo won again a ICSC Silver Solal Marketing Award with Friendship<br />
Recycling Centre. This pedagogic project aimed to raise children´s and parent´s social<br />
awareness. These Silver Awards mean a lot for Forum Montijo, considering that the whole<br />
of Europe is represented at the Awards and that they confer international recognition<br />
of the best work in the field and of the most effective campaigns.<br />
Property Report<br />
43
44<br />
Forum Montijo<br />
Forum Montijo Catchment Area<br />
Lisboa<br />
Almada<br />
Source: www.viamichelin.de<br />
LISBOA<br />
Rio Tejo<br />
Alcochete<br />
Forum Montijo<br />
Seixal<br />
Barreiro<br />
Quinta do Conde<br />
Moita<br />
Montijo<br />
Pinhal Novo<br />
Palmela<br />
Setúbal<br />
Primary catchment<br />
Secondary catchment<br />
Ever since it opened, Forum Sesimbra Montijo has steadily widened its catchment area and increased<br />
its market share. Annexed to the mall is a complementary retail park, which will enhance<br />
the whole retail agglomeration as the region’s leading shopping and recreational<br />
destination. In its leadership role, the scheme is likely to benefit disproportionately from<br />
the forecast demographic growth in the eastern half of Setubal Peninsula. A constant<br />
adjustment of the retail mix by sector and tenant by the centre management ensures that<br />
customers‘ needs are always met.
Forum Montijo
46<br />
4. Espacio León<br />
The city of León is the capital of León province in the autonomous community of Castile and<br />
León in northwest Spain. Home to more than a quarter (135,000) of the province’s total population<br />
(nearly 500,000), the city is the largest municipality in the province. The shopping<br />
centre Espacio León is situated on the northern fringe of the city of León, on the left bank<br />
of the River Bernesga, an area undergoing major urban development. The scheme is only a<br />
five- to eight- minute drive from downtown, and is easy to reach by car and public transport.<br />
Espacio León is the first shopping centre in the León region. The architectural concept of<br />
the centre was inspired by modern Spanish design. Using the same material for parts of<br />
the building’s facade as went into the construction of the Guggenheim Museum in Bilbao,<br />
the mall attained architectural fame, and has become a major attraction in the region.<br />
The shopping areas are spread over three floors and are fully roofed to make sure shoppers<br />
find an agreeable environment even in inclement weather, which is hardly uncommon<br />
in this area. Shielded from the natural elements, the mall features a sculptural theme<br />
and includes boulevards, public spaces and landscaped areas. The innovative and exclusive<br />
approach of the visual and functional concept made Espacio León a finalist in the 2006<br />
ICSC European Shopping Centre Awards among three other <strong>malls</strong> in its category.<br />
Espacio León, which opened in October 2004, comprises 113 shops/retail units on more<br />
than 36,000 sqm. The merchandise breaks down into a wide range of consumer goods.<br />
The basement has direct access to the multi-storey car park, which provides a major<br />
share of the mall’s 1,300 free parking spaces. The basement includes a supermarket<br />
of 3,000 sqm, as well as the main stores for sporting goods, toys, and electronics. The<br />
ground floor features mainly fashion and accessories stores, as does the main lobby area<br />
and the mall area on the first floor up. Located at the other end of the building is a food<br />
court, comprising local restaurants as well as renowned international chains. At one side<br />
of the food court square is the entrance to a 9-screen cinema. The table below shows the<br />
top 10 tenants in terms of annual rental income (sorted by floor space):<br />
Name Area Sector End of Term<br />
CINEBOX 4,000 sqm Leisure 10/2019<br />
MEDIAMARKT 3,469 sqm Home equipment 10/2019<br />
SUPERCOR 3,014 sqm Services 10/2029<br />
FORUM SPORT 2,100 sqm Fashion 10/2014<br />
ZARA 1,972 sqm Fashion 10/2024<br />
HENNES & MAURITZ 1,741 sqm Fashion 10/2024<br />
MIRÓ 771 sqm Home equipment 11/2016<br />
MASSIMO DUTTI 614 sqm Fashion 10/2024<br />
BERSHKA 568 sqm Fashion 10/2024<br />
GASOLINERA 150 sqm Others 02/2039<br />
Source: <strong>Commerz</strong> <strong>Real</strong> Group
In the difficult year 2009, we successfully renewed the leases of 48 tenants in Leon, and<br />
signed to 2 substitutions, which accounts for 91% of the total renewal options, for 49%<br />
of the total rent, and for 43% of the GLA. Due to the economic situation, the level of discounts<br />
and rentfree period increased, but must be seen in context with the overall aim to<br />
maintain the tenant mix and to stabilize the rental value. In León, discounts were granted<br />
to 22 tenants and rent free period to 4 tenants. In Leon there were 16 new contracts.<br />
The average remaining lease term was 7.3 years as of 31 December 2009 (on the basis of<br />
remaining lease term per unit, weighted by rental income per unit). By the end of December<br />
2009, the mall reported 10 vacant units (15 without rent guarantees), which translates<br />
into a vacancy rate in sqm of 5.3% (7.1% without rent guarantee). Generally, the<br />
Espacio León is very attractive for its customers because of the high number of renowned<br />
international retailers besides the anchor tenants, including The Phone House, Bershka,<br />
Bull & Bear, Springfield, Bata, and Poly.<br />
León Lease Expiration in % of total rental income<br />
The following table and chart show the mall’s lease expiration profile:<br />
León Lease Expiration in % of Total Rental Income as at 31 December 2009<br />
30%<br />
27.3%<br />
25%<br />
20%<br />
15%<br />
10%<br />
5%<br />
0%<br />
5.6%<br />
2010<br />
9.9%<br />
2011<br />
14.5%<br />
2012<br />
1.2%<br />
2013 2014<br />
1.1%<br />
2015 2016 2017 2018 2019 2020+<br />
3.0% 0.5% 0.0%<br />
16.7%<br />
20.2%<br />
2009 2010 2011 2012 2013 2014 2015 2016 2017 2018 2019+<br />
With its existing vacancy rate the centre offers the potential to be optimised; this is a<br />
major task to be completed in the near future.<br />
Property Report<br />
Year of Expiration in %<br />
2010 5.6%<br />
2011 9.9%<br />
2012 14.5%<br />
2013 1.2%<br />
2014 27.3%<br />
2015 1.1%<br />
2016 3.0%<br />
2017 0.5%<br />
2018 0.0%<br />
2019 16.7%<br />
2020+ 20.2%<br />
100.0%<br />
47
48<br />
Parking<br />
Parking<br />
Espacio León floor plans<br />
Shops by group of activity - level 1<br />
Source: <strong>Commerz</strong> <strong>Real</strong> Group<br />
Fashion Supermarket Restaurant<br />
Home equipment Personal Accessoires Services<br />
Leisure<br />
Shops by group of activity - level 2<br />
Fashion Home equipment Personal Accessoires<br />
Services<br />
Shops by group of activity - level 3<br />
Fashion Restaurant<br />
Leisure<br />
Source: <strong>Commerz</strong> <strong>Real</strong> Group<br />
Source: <strong>Commerz</strong> <strong>Real</strong> Group
According to the GfK (November 2007), almost 280,000 people live in the catchment<br />
area of Espacio León, while more than 100,000 live in its direct vicinity. The mall offers<br />
an attractive and complete mix of store types, restaurants and bars, recreational facilities<br />
and a multiplex cinema. Due to the rural environment and the lack of attractive<br />
shopping alternatives, the Espacio León has a major potential for drawing most of the<br />
purchasing power in the catchment area. Thus, the success of Espacio León is unlikely to<br />
be qualified by the fact that the purchasing power index for the catchment area exceeds<br />
the national average only slightly at 100.2, especially as the index for customers in direct<br />
vicinity of the mall is 106.6. Furthermore, it is to be expected that the population in the<br />
direct vicinity of the mall could grow in the coming years because further new residential<br />
developments in the surrounding district are planned. In 2009, the fifth year of<br />
operation, the mall registered a footfall of 4.7 million.<br />
Espacio Leôn Catchment Area<br />
León<br />
Source: www.viamichelin.de<br />
Astorga<br />
La Bañeza<br />
Espacio León<br />
León<br />
La Robla<br />
Villamañán<br />
Villarente<br />
Primary catchment<br />
Secondary catchment<br />
Cisterna<br />
Almanza<br />
In 2009, sales amounted to EUR 79.5 million, which translates into a turnover of<br />
EUR 2,600 per sqm. Espacio León generated a rental income of EUR 7.6 million in 2009<br />
(including base rent, turnover rent and temporary letting income). The rental income<br />
includes a rental guarantee for vacant areas by the developer that will extend through<br />
2012. The effort index (rent / sales ratio) of 11% was very attractive for the tenants in<br />
2009.<br />
Apart from several hypermarkets and the smaller León Plaza (18,500 sqm) that is positioned<br />
closer to the city of León, Espacio León remains unrivalled in the region to date.<br />
The closest shopping centres with a similar offering and size are located in Ponferrada,<br />
approx. 100 km away from León, in Oviedo more than 130 km away, and in Lugo more<br />
than 220 km away. So the centre must position itself vis-à-vis traditional shopping<br />
Property Report<br />
49
50<br />
Espacio León<br />
streets in the inner city that are characterised by a less attractive brand and tenant mix.<br />
The unique position of the centre will most likely benefit from overly restrictive planning<br />
policy by the government in regard to regional shopping centres. This means that Espacio<br />
León will remain sheltered from intensive competition by other large retail agglomerations<br />
in the near future.<br />
The mall has the potential too become the primary shopping centre destination of the city<br />
of León and the entire region. Espacio León is still in the early market penetration phase<br />
and needs to be managed actively. <strong>Commerz</strong> <strong>Real</strong> Group is actively collaborating with the<br />
local centre management to implement its dual optimisation approach: active centre marketing<br />
and proactive letting activities combine with an ongoing review of the brand and<br />
tenant mix to secure the appreciation of the property over time. Pinpoint marketing campaigns<br />
will strengthen the position and acceptance of the scheme in the catchment area.
52<br />
Financial Report<br />
1. Adjustments between Trading NAV and pure IFRS<br />
In order to properly reflect the Fund’s open-ended character, several adjustments to a<br />
pure IFRS accounting approach have been made.<br />
For the official NAV as at 31 December 2009, there are basically three adjustments to<br />
report: the capitalisation and subsequent amortisation of the acquisition costs associated<br />
with the purchase of Espacio Leôn, the capitalisation and amortisation of key monies in<br />
Portugal and the elimination of the deferred taxes imputed for the positive revaluation<br />
of the two existing loans of Almada Cda. and Brafero S.A. Future adjustments might be<br />
made subject to the decision by the Management Company which is subject to an UAC<br />
approval.<br />
The Fund spent a total amount of EUR 1,603,224.71 toward the acquisition of Espacio<br />
León. The amount was fully capitalized by the acquisition date (31 October 2007), and<br />
will be amortized over a period of four years or 48 months. This implies a 26 months<br />
amortisation period by 31 December, 2009, amounting to EUR 868,413.53.<br />
The table below shows the calculation details:<br />
Depreciation of acquisition costs<br />
Stamp duty 1,560,000.00<br />
Fees 43,225.00<br />
Total capitalised costs 1,603,225.00<br />
Depreciation Nov 2007 - Dec 2009 -868,413.53<br />
Capitalised costs as at 31 December 2009 734,811.47<br />
In conjunction with the acquisition of the companies in October 2007, the share price<br />
for the companies was adjusted to reflect certain items (deferred key money in Portugal,<br />
among others).<br />
The so-called key money is paid by a tenant at the moment he enters into a lease agreement<br />
at any of the centres or renews his leasing agreement. The amount is paid – according<br />
to the lease – in order to compensate the owner for any investment undertaken in<br />
that business (to cover the launching campaign, the opening ceremony, the media coverage,<br />
and the business scheme itself). According to the Portuguese GAAP, the respective<br />
payment must be deferred in the balance sheet of the recipient for the duration of the<br />
lease term. However, as it is not refundable in case the tenant terminates the lease prior<br />
to the expiration date, and therefore the deferred income positions in the balance sheet<br />
lack a genuine liability character. From an economical point of view, the amount belongs<br />
to the party who owns the property at the moment of payment. To reflect this properly,<br />
<strong>CG</strong> <strong>malls</strong> <strong>europe</strong> compensated the seller for this deferred income position by discounting
the future net tax income to the closing date. The amounts that were actually paid as<br />
compensation for the company’s equity in 2007 equalled EUR 1,858,855.52 for Almada<br />
Lda. and EUR 658,649.67 for Montijo Lda. It was intended to activate these payments in<br />
the balance sheets of the acquiring companies as goodwill and amortize this position<br />
during the term of the underlying deferred income positions. The Fund’s auditor decided<br />
that such approach is not feasible, i.e. that these payments fail to qualify as goodwill<br />
pursuant to IFRS requirements. Accordingly, the sum total of EUR 2,517,505.19 had to be<br />
written off in 2007.<br />
We believe that this treatment of the paid compensation fails to reflect the Fund’s<br />
fairvalue trading NAV, and that it may cause a dissimilar treatment of investors because<br />
future investors will pay too little for purchased shares. Therefore, we suggested to our<br />
investors to adjust the trading NAV of the Fund in the PPM by the amortized value of the<br />
compensation paid for the deferred key money. Once investors accepted the proposal to<br />
adjust the PPM by end of March 2008, the written off amount of 2007 was activated on a<br />
reduced level (EUR 2,279,515.51 by the end of 2008) and included in all NAV calculations<br />
since 2008.<br />
Amortisation of key monies<br />
Capitalised key monies Almada 1,858,855.52<br />
Capitalised key monies Montijo 658,649.67<br />
Total key monies 2,517,505.19<br />
Amortisation Nov 2007 - Dec 2009 -441,376.20<br />
Key monies as at 31 December 2009 2,076,128.99<br />
With the revaluation of the two existing loans that were purchased in context with acquiring<br />
Almada Cda. and Brafero S.A., the two companies made an unrealised capital gain.<br />
According to IFRS, the companies had to account for a respective deferred tax position<br />
because – theoretically speaking – this gain was realised and is therefore subject to Portuguese<br />
CIT tax rate of 26.5% in case the loans would be sold to a third party. Since these<br />
loans are not supposed to be sold, these positions are not to be taken into account for<br />
calculating the trading NAV. The deferred tax liabilities will be written-off in the future<br />
in accordance with the write-up of the loans up to their respective redemption amount.<br />
The following table shows the calculation of the deferred tax liabilities as at 31 December<br />
2009.<br />
Financial Report<br />
Company DTL due to Valuation End Days Total write-off DTL end<br />
loan valuation date of period amount 2007-2009 of period<br />
Almada Cda. 426,724.73 31/10/2007 31/12/2009 793 317,441.57 109,283.16<br />
Brafero S.A. 260,042.91 31/10/2007 31/12/2009 793 193,992.50 66,050.41<br />
Total 686,767.64 511,434.07 175,333.57<br />
53
54<br />
The adjustments between IFRS NAV and Trading NAV (Fund GAAP) add up to a total<br />
positive adjustment of EUR 2,986,274.04.<br />
2009 2008<br />
Pure IFRS NAV 204,200,157.83 252,753,043.28<br />
Non- IFRS capitalised expenses 1,603,225.00 1,603,225.00<br />
Amortization of Non-IFRS capitalised expenses - 868,413.53 - 467,561.75<br />
Capitalization of key monies 2,517,505.19 2,517,505.19<br />
Amortization of capitalised Key-moneys - 441,376.20 - 237,989.68<br />
Elimination of Deferred Tax Liability Portugal 175,333.58 677,364.15<br />
Trading NAV 207,186,431.87 256,845,586.19<br />
2. Financing Strategy<br />
The overall financing has been structured in such a way as to maximize the return on<br />
equity for the investors of <strong>CG</strong> <strong>malls</strong> <strong>europe</strong>. To achieve this, a mix of internal and external<br />
financing facilities is in place. While external financing is only found on the level of<br />
the property holding companies and – in Portugal – the operating companies, the internal<br />
loans are used throughout the structure to fund the various entities.<br />
Property Currency Redemption Draw-down Maturity<br />
amount date<br />
Almada Forum EUR 35,800,000.00 31.10.2007 24.10.2017<br />
Almada Forum EUR 90,175,323.50 27.06.2001 31.12.2012<br />
Almada Forum EUR 45,000,000,00 24.10.2007 18.10.2017<br />
Forum Montijo EUR 90,670,000.00 31.10.2007 24.10.2017<br />
Forum Montijo EUR 55,000,000.00 29.09.2003 29.09.2010<br />
Espacio León EUR 61,980,000.00 31.10.2007 04.09.2017<br />
Total: 378,625,323.50
2.1 Internal Loan Portfolio<br />
The table below lists all internal loans, including lender, borrower, and loan total as<br />
at 31 December 2009. In April 2010, the shareholder loan from <strong>CG</strong>M LUX 3 to León<br />
PropCo was converted into a profit participation loan (PPL) and was increased by EUR<br />
4,000,000.00 to EUR 38,361,156.86.<br />
Internal financing agreements<br />
Lender/ Borrower/ Amount<br />
Type of financing shareholder recipient<br />
PPL <strong>CG</strong> <strong>malls</strong> <strong>europe</strong> <strong>CG</strong>M LUX 1 289,833,402.06<br />
PPL <strong>CG</strong>M LUX 1 <strong>CG</strong>M LUX 2 97,862,982.65<br />
PPL <strong>CG</strong>M LUX 1 <strong>CG</strong>M LUX 3 191,950,419.40<br />
Shareholder Loan <strong>CG</strong>M LUX 2 Almada Lda. 96,844,069.52<br />
Shareholder Loan <strong>CG</strong>M LUX 3 Montijo Lda. 69,473,566.83<br />
Intra-group Loan Montijo Lda. Almada Lda. 42,663,800.00<br />
Shareholder Loan <strong>CG</strong>M LUX 3 León PropCo 34,361,156.86<br />
2.2 External Loan Portfolio<br />
The loan balance by the key date totalled EUR 378,625,323.50. All external loan facilities<br />
are directly or indirectly used for real estate financing purposes. The benefit of partial<br />
outside financing is the tax optimisation through deductibility of the interest rates abroad.<br />
Loans are principally taken out in the local currency of the property to be financed.<br />
Accordingly, we took 100% of the loans out in EUR.<br />
End of fixed Fixed / Interest Lender Borrower<br />
interest period floating in %<br />
24.10.2017 fixed 5.078 Eurohypo Portugal Almada Lda.<br />
30.09.2010 fixed 4.410 Eurohypo Portugal Almada Cda.<br />
18.10.2017 fixed 5.079 Eurohypo Portugal Almada Cda.<br />
24.10.2017 fixed 5.078 Eurohypo Portugal Montijo Lda.<br />
29.09.2010 fixed 4.760 Eurohypo Portugal Brafero S.A.<br />
04.09.2017 fixed 5.071 Eurohypo Spain León PropCo<br />
Financial Report<br />
55
56<br />
The table below shows the entire debt loan portfolio of <strong>CG</strong> <strong>malls</strong> <strong>europe</strong> by countries.<br />
Loan Volume by Countries, as at 31 December 2008<br />
Spain 16.4 %<br />
Portugal 83.6 %<br />
The loans are totally secured by real estate mortgages. In order to take long-term advantage<br />
of the tax optimization as well as of the leverage effect throughout the entire<br />
lifetime of the loan, outside financing is almost exclusively structured for repayment at<br />
final maturity.<br />
Structure of the loan interest fixings in % in %<br />
Less than 1 year 38.34%<br />
1-2 years 0.00%<br />
2-5 years 0.00%<br />
5-10 years 61.66%<br />
more than 10 years 0.00%<br />
Weighted average cost of debt 4.87%<br />
The target gearing of the Fund is 60% in relation to the market values of the properties<br />
within a fiscal year. The depreciations of the properties in 2009 have lowered the<br />
appraised market value so far that it has driven up the gearing ratio to currently 66.9%.<br />
As a recovery of the real estate values is not to be expected before the end of the year,<br />
we assume that <strong>CG</strong> <strong>malls</strong> <strong>europe</strong> will have to report a passive breach of the loan-to-value<br />
principles of the PPM for 2009. The management board discussed the ramifications of<br />
the margin violation in its meetings of 17 February 2009 and 08 September 2009, and is<br />
seeking a medium-term reduction of the gearing ratio.<br />
Gearing in %<br />
Total market value investment properties 565,818,000.00<br />
Total long-term debt (redemption values) 378,625,323.50<br />
Gearing in % 66.9%
With the purchase of Almada Cda. and Brafero S.A., two existing loans were bought,<br />
amounting to EUR 90,175,323.50 in Almada Cda. and EUR 55,000,000.00 in Brafero S.A.<br />
The comparison of the fixed interest rates and current market conditions as of 31 October<br />
2007 revealed that the fixed conditions would be much more attractive. The seller of<br />
the companies received compensation. The amounts, calculated for the remaining fixedinterest<br />
period of the respective loans, were EUR 1,610,282.00 for the loan in Almada<br />
Cda. and EUR 981,294.00 for the loan in Brafero S.A. Accordingly, the respective loans<br />
have been revalued in the balance sheets of the companies, resulting in a decrease in<br />
the loan value in the balance sheet and an increase in the companies’ equity. Over the<br />
remaining fixed-interest period, the loan amounts will be written-up to the redemption<br />
amounts against the respective equity position. From 2007 to 2009, the loan in Almada<br />
Cda. was written-up with an amount of EUR 1,197,893.00 and the loan in Brafero S.A.<br />
with an amount of EUR 732,046.00. This brings the total value, including León, up to<br />
EUR 377,251,934.50 as at 31 December 2009.<br />
Fair value of loans as at 31 December 2009<br />
Financial Report<br />
Company Loan amount Fair value as Total write-up Total write-up Loan amount as<br />
at purchase amount amount 2007 - 2009 at 31.12.2009<br />
Almada Cda. 90,175,323.50 88,565,041.50 1,610,282.00 1,197,893.00 89,762,934.50<br />
Brafero S.A. 55,000,000.00 54,018,706.00 981,294.00 732,046.00 54,750,752.00<br />
León PropCo 61,980,000.00 60,974,831.00 1,005,169.00 293,417.00 61,268,248.00<br />
other loans 171,470,000.00 171,470,000.00 0.00 0.00 171,470,000.00<br />
Total 378,625,323.50 375,028,578.50 3,596,745.00 2,222,952.00 377,251,934.50<br />
57
58<br />
Valuers Statement<br />
<strong>CG</strong> <strong>Real</strong> Estate Luxembourg S.à.r.l.<br />
25 rue Edward Steichen<br />
L-2540 Luxembourg<br />
July 08, 2009<br />
Valuers Statement - Re-Valuation of the retail properties of the<br />
<strong>CG</strong> <strong>Real</strong> Estate Master FCP-SIF <strong>CG</strong> <strong>malls</strong> <strong>europe</strong> as at June<br />
2009<br />
To whom it may concern,<br />
Cushman & Wakefield LLP<br />
Westhafenplatz 6<br />
60327 Frankfurt am Main<br />
Tel +49 69 50 60 73 0<br />
Fax +49 69 50 60 73 400<br />
www.cushmanwakefield.de<br />
E-Mail: info.de@eur.cushwake.com<br />
In accordance with your written instruction dated May 22, 2009 we have prepared a revaluation<br />
of the three retail properties of the <strong>CG</strong> <strong>Real</strong> Estate Master FCP-SIF <strong>CG</strong> <strong>malls</strong><br />
<strong>europe</strong> fund which we initially valued in October 2007 and last re-valued in December<br />
2008.<br />
We performed the current valuation on the basis of the information provided to us<br />
electronically on May 14, 2009. The current market environment was also taken into<br />
consideration. We are now pleased to provide you with our results based on a DCF model.<br />
Our input assumptions as well as changes concerning the property and/or market<br />
environment since our previous valuation will be detailed in the individual summary<br />
valuation reports.<br />
Having given the matter careful consideration we are of the opinion that the Market Value<br />
of the subject properties as at June 01, 2009 was in the order of:<br />
Property City Country Market Value<br />
Forum Almada Almada Portugal 344.748.000<br />
Forum Montijo Montijo Portugal 157.977.000<br />
Espacio Leon León Spain 79.950.000<br />
Total 582.675.000<br />
Yours sincerely,<br />
CUSHMAN & WAKEFIELD LLP<br />
Martin Belik MRICS i.A. Tony Loughran MRICS i.A. Eric Van Leuven FRICS<br />
Head of VAS, Germany Head of VAS, Spain Managing Partner, Portugal<br />
Cushman & Wakefield LLP Frankfurt Branch ist eine Niederlassung der Cushman & Wakefield LLP mit Sitz in London, die beim<br />
Companies House in Großbritannien unter OC 328588 als Partnerschaftsgesellschaft englischen Rechts ohne persönliche Haftung<br />
der Partner ("LLP") registriert ist. Eine Liste der Partner kann eingesehen werden am obigen Sitz der Niederlassung.<br />
Umsatzsteuer-Identifikationsnummer: DE 213 062 633<br />
Bankverbindung: Barclays Bank Plc Konto-Nr.: 07 365 440 01 BLZ 503 104 00 IBAN DE14 5031 0400 0736 5440 01
<strong>CG</strong> <strong>Real</strong> Estate Luxembourg S.à.r.l.<br />
25 rue Edward Steichen<br />
L-2540 Luxembourg<br />
November 17, 2009<br />
Valuers Statement - Re-Valuation of the retail properties of the<br />
<strong>CG</strong> <strong>Real</strong> Estate Master FCP-SIF <strong>CG</strong> <strong>malls</strong> <strong>europe</strong> as at<br />
November 2009<br />
To whom it may concern,<br />
Cushman & Wakefield LLP<br />
Westhafenplatz 6<br />
60327 Frankfurt am Main<br />
Tel +49 69 50 60 73 0<br />
Fax +49 69 50 60 73 400<br />
www.cushmanwakefield.de<br />
E-Mail: info.de@eur.cushwake.com<br />
In accordance with your written instruction dated October 13, 2009 we have prepared a revaluation<br />
of the three retail properties of the <strong>CG</strong> <strong>Real</strong> Estate Master FCP-SIF <strong>CG</strong> <strong>malls</strong><br />
<strong>europe</strong> fund which we initially valued in October 2007 and last re-valued in June 2009.<br />
We performed the current valuation on the basis of the information provided to us<br />
electronically on October 16, 2009. The current market environment was also taken into<br />
consideration. We are now pleased to provide you with our results based on a DCF model.<br />
Our input assumptions as well as changes concerning the property and/or market<br />
environment since our previous valuation will be detailed in the individual summary<br />
valuation reports.<br />
Having given the matter careful consideration we are of the opinion that the Market Value<br />
of the subject properties as at November 17, 2009 was in the order of:<br />
Property City Country Market Value<br />
Forum Almada Almada Portugal 333.597.000<br />
Forum Montijo Montijo Portugal 154.481.000<br />
Espacio Leon León Spain 77.740.000<br />
Total 565.818.000<br />
Yours sincerely,<br />
CUSHMAN & WAKEFIELD LLP<br />
Martin Belik MRICS i.A. Tony Loughran MRICS i.A. Eric Van Leuven FRICS<br />
Head of VAS, Germany Head of VAS, Spain Managing Partner, Portugal<br />
Cushman & Wakefield LLP Frankfurt Branch ist eine Niederlassung der Cushman & Wakefield LLP mit Sitz in London, die beim<br />
Companies House in Großbritannien unter OC 328588 als Partnerschaftsgesellschaft englischen Rechts ohne persönliche Haftung<br />
der Partner ("LLP") registriert ist. Eine Liste der Partner kann eingesehen werden am obigen Sitz der Niederlassung.<br />
Umsatzsteuer-Identifikationsnummer: DE 213 062 633<br />
Bankverbindung: Barclays Bank Plc Konto-Nr.: 07 365 440 01 BLZ 503 104 00 IBAN DE14 5031 0400 0736 5440 01<br />
Valuers Statement<br />
59
<strong>Commerz</strong> <strong>Real</strong> Estate Master FCP – SIF<br />
NOTES TO THE CONSOLIDATED FINANCIAL STATEMENTS<br />
AS AT DECEMBER 31, 2009<br />
Almada Forum
Financial Statements<br />
Financial Statements<br />
61
<strong>Commerz</strong> <strong>Real</strong> Estate Master FCP – SIF<br />
Consolidated Statement of Financial Position<br />
(expressed in EUR)<br />
The notes on pages 22 to 59 are an integral part of these consolidated financial statements<br />
Financial Statements<br />
63
64<br />
<strong>Commerz</strong> <strong>Real</strong> Estate Master FCP – SIF<br />
Consolidated Statement of Comprehensive Income<br />
(expressed in EUR)<br />
* Previous year figures have been amended on management decision to reflect changes in<br />
allocation of operational costs in 2009. For details please refer to note 2.21.<br />
The notes on pages 22 to 59 are an integral part of these consolidated financial statements
<strong>Commerz</strong> <strong>Real</strong> Estate Master FCP – SIF<br />
Consolidated Statement of Changes in Equity<br />
for the year ended December 31, 2009<br />
(expressed in EUR)<br />
The notes on pages 22 to 59 are an integral part of these consolidated financial statements<br />
21<br />
Financial Statements<br />
65
66<br />
<strong>Commerz</strong> <strong>Real</strong> Estate Master FCP – SIF<br />
Consolidated Statement of Cash Flows<br />
for the year ended December 31, 2009<br />
(expressed in EUR)<br />
Investing and financing transactions that did not require the use of cash or cash equivalents are<br />
excluded from the cash flow statement. The group did not enter into such transactions during<br />
2009 or 2008.<br />
The notes on pages 22 to 59 are an integral part of these consolidated financial statements<br />
22
<strong>Commerz</strong> <strong>Real</strong> Estate Master FCP – SIF<br />
NOTES TO THE CONSOLIDATED FINANCIAL STATEMENTS<br />
AS AT DECEMBER 31, 2009<br />
1. General information and current operating environment<br />
<strong>Commerz</strong> <strong>Real</strong> Estate Master FCP-SIF formerly <strong>CG</strong> <strong>Real</strong> Estate Master FCP-SIF (hereafter the “Fund”) was launched on<br />
June 4, 2007 as an open-ended fonds commun de placement - fonds d‘investissement spécialisé, under the laws of the<br />
Grand-Duchy of Luxembourg. Its assets are held in common by, and managed in the interest of its co-owners (the “Unit<br />
holders”) by <strong>CG</strong> <strong>Real</strong> Estate Luxembourg S.à r.l., Register of Commerce Number B126.731 (the “Management Company”).<br />
The registered office is located in 25, rue Edward Steichen, L-2540 Luxembourg. The Fund’s financial year starts<br />
on January 1st and ends on December 31st of each period. These audited consolidated financial statements are the third<br />
report covering the period January 1, 2009 to December 31, 2009. The consolidated financial statements of the Fund are<br />
presented in Euro (EUR).<br />
The Fund has adopted an “umbrella” structure and currently consists of one sub-fund:<br />
- <strong>CG</strong> <strong>malls</strong> <strong>europe</strong> (the “Sub-fund”)<br />
In seeking to achieve the investment objectives of the Sub-fund, the Fund invests in properties and related real estate<br />
investments across Europe. The geographic allocation targets are 70% of aggregated investments in European Core<br />
Markets and 30% of aggregate investments in European Emerging Markets, whereas not more than a total of 20% of<br />
the aggregate investments shall be invested in Turkey, Croatia and Macedonia as long as these countries are EU candidate<br />
countries.<br />
The Fund may, directly or indirectly, grant loans of any kind to its Subsidiaries in order inter alia to finance the acquisition<br />
of any investment made by any Subsidiaries.<br />
The consolidated financial statements have been approved for issue by the Board of Directors on April 15, 2010. The<br />
unitholders have the power to amend the consolidated financial statements after issue.<br />
Recent volatility in global and European financial markets<br />
The ongoing global liquidity crisis which commenced in the middle of 2007 has resulted in, among other things, a lower<br />
level of capital market funding, lower liquidity levels across the banking sector, and, at times, higher interbank lending<br />
rates and very high volatility in the stock markets. The uncertainties in the global financial markets have led to bank<br />
failures and bank rescues in the United States of America, Western Europe, Russia and elsewhere. Indeed the full extent<br />
of the impact of the ongoing financial crisis is still proving to be impossible to anticipate or completely guard against:<br />
Impact on Liquidity<br />
Financial Statements<br />
The volume of wholesale financing has significantly reduced since mid-2007. Such circumstances may affect the ability<br />
of the Fund to obtain new borrowings and re-finance its existing borrowings at terms and conditions similar to those<br />
applied to earlier transactions. The Fund will require to refinance one of the loans during the financial year 2010. Despite<br />
the current market situation the terms and conditions for the renewal are not expected to have major influence on<br />
the Fund‘s liquidity.<br />
67
68<br />
<strong>Commerz</strong> <strong>Real</strong> Estate Master FCP – SIF<br />
NOTES TO THE CONSOLIDATED FINANCIAL STATEMENTS<br />
AS AT DECEMBER 31, 2009<br />
1. General information and current operating environment (continued)<br />
Impact on tenants and other debtors<br />
Tenants and debtors of the Fund may be affected by the lower liquidity situation which could in turn impact their ability<br />
to pay/repay the amounts owed.<br />
Deteriorating operating conditions for tenants and other debtors may also have an impact on management’s cash flow<br />
forecasts and assessment of the impairment of assets. To the extent that information is available, management has properly<br />
reflected revised estimates for future cash flows in its impairment assessments.<br />
Valuation of investment properties<br />
For many types of real estate the markets in Portugal and Spain have been severely affected by the recent volatility in<br />
global financial markets. As such the carrying values of investment properties measured at fair value in accordance<br />
with IAS 40 have been updated to reflect market conditions at the reporting date.<br />
2. Significant accounting policies<br />
The principal accounting policies adopted in the preparation of these consolidated financial statements are set out<br />
below. These policies have been consistently applied to all the years presented, unless otherwise stated.<br />
2.1. Basis of preparation<br />
The consolidated financial statements of the Fund have been prepared in accordance with International Financial<br />
Reporting Standards as adopted by the European Union (“IFRS”). The consolidated financial statements have been<br />
prepared under the historical cost convention modified for the revaluation of investment properties, financial assets and<br />
financial liabilities at fair value through profit or loss.<br />
The preparation of financial statements in conformity with IFRS requires the use of certain critical accounting estimates.<br />
It also requires management to exercise its judgement in the process of applying the group’s accounting policies.<br />
Consolidated statements of comprehensive income and cash flows<br />
The Fund presents the consolidated statement of comprehensive income by nature of expense.<br />
The Fund reports cash flows from operating activities using the indirect method.<br />
The acquisitions of investment properties are disclosed as cash flows from investing activities because this most appropriately<br />
reflects the Funds business activities.<br />
Cash flows from investing and financing activities are determined using the direct method.
<strong>Commerz</strong> <strong>Real</strong> Estate Master FCP – SIF<br />
NOTES TO THE CONSOLIDATED FINANCIAL STATEMENTS<br />
AS AT DECEMBER 31, 2009<br />
2.1. Basis of preparation (continued)<br />
The preparation of financial statements in conformity with IFRS (as adopted by the EU) requires the use of certain critical<br />
accounting estimates. It also requires management to exercise its judgement in the process of applying the Fund’s<br />
accounting policies. Changes in assumptions may have a significant impact on the financial statements in the period the<br />
assumptions changed. Management believes that the underlying assumptions are appropriate. The areas involving a<br />
higher degree of judgement or complexity, or areas where assumptions and estimates are significant to the consolidated<br />
financial statements are disclosed in note 4.<br />
(a) Standards and amendments to existing standards effective January 1, 2009<br />
Financial Statements<br />
The following standards, amendments and interpretations are mandatory for accounting periods beginning on or after<br />
January 1, 2009 and are of relevance to the Fund:<br />
Standard/ Content Applicable for financial<br />
Interpretation years beginning on / after<br />
IAS 1 Presentation of financial statements January 1, 2009<br />
IAS 23 Borrowing costs January 1, 2009<br />
IAS 32 and IAS 1 Puttable financial instruments and obligations arising on liquidation January 1, 2009<br />
IFRS 7 Amendment: Improving disclosures about financial instruments January 1, 2009<br />
IFRIC 15 Agreements for the construction of real estate January 1, 2009<br />
IAS 40R Investment property January 1, 2009<br />
• IAS 1, ‘Presentation of financial statements’ A revised version of IAS 1 was issued in September 2007. The revised<br />
standard prohibits the presentation of items of income and expenses (that is, ‘non-owner changes in equity’) in the<br />
statement of changes in equity, requiring ‘non-owner changes in equity’ to be presented separately from owner<br />
changes in equity in a statement of comprehensive income. As a result, the Group presents in the consolidated<br />
statement of changes in equity all owner changes in equity; all non-owner changes in equity are presented in the<br />
consolidated statement of comprehensive income. The adoption of this revised standard impacts only presentation<br />
aspects; therefore, it has no impact on the Fund’s net assets.<br />
• IAS 23, ‘Borrowing costs’ A revised version was issued in March 2007. Under the revised standard, an entity is required<br />
to capitalise borrowing costs directly attributable to the acquisition, construction or production of a qualifying<br />
asset (one that takes a substantial period of time to get ready for use or sale) as part of the cost of that asset. The option<br />
of immediately expensing those borrowing costs was removed. The capitalisation is required for qualifying assets for<br />
which the commencement date for capitalisation is on or after 1 January 2009. For qualifying assets measured at fair<br />
value inventories, that are manufactured or otherwise produced in large quantities on a repetitive basis, the application<br />
of IAS 23 is not required. The Group has applied this standard in accordance with the transition provisions. Since at reporting<br />
date no qualifying assets were held or had been sold by the Fund, the adoption had no impact on its net assets.<br />
69
70<br />
<strong>Commerz</strong> <strong>Real</strong> Estate Master FCP – SIF<br />
NOTES TO THE CONSOLIDATED FINANCIAL STATEMENTS<br />
AS AT DECEMBER 31, 2009<br />
2.1. Basis of preparation (continued)<br />
• IAS 32 (Amendment), ‘Financial instruments: Presentation’ and IAS 1 (Amendment), ‘Presentation of financial<br />
statements – Puttable financial instruments arising on liquidation’. The amendments are part of the IASB’s annual<br />
improvements project published in May 2008 and are effective from January 1, 2009. The amended standards require<br />
entities to classify puttable instruments and instruments, or components of instruments that impose on the entity<br />
an obligation to deliver to another party a pro rata share of the net assets of the entity only on liquidation as equity,<br />
provided the financial instruments have particular features and meet specific conditions, including that all financial<br />
instruments in the class of instruments that is subordinate to all other instruments have identical features. The<br />
management of the Fund opted for an early adoption of the amendment for the financial year 2008. As the Fund’s<br />
redeemable shares are issued as one class of shares and the conditions defined in the amendment are fulfilled, the<br />
issued shares of the Fund are classified as equity, resulting in the same disclosure of the redeemable shares as last<br />
year.<br />
• Amendment: IFRS 7, ‘Improving disclosures about financial instruments’ The IASB published amendments to IFRS 7<br />
in March 2009. The amendment requires enhanced disclosures about fair value measurements and liquidity risk. In<br />
particular, the amendment requires disclosure of fair value measurements by level of a three-level fair value measurement<br />
hierarchy. In addition to that, the amendment clarifies that the maturity analysis of liabilities should include<br />
issued financial guarantee contracts at the maximum amount of the guarantee in the earliest period in which the guarantee<br />
could be called; and secondly requires disclosure of remaining contractual maturities of financial derivatives<br />
if the contractual maturities are essential for an understanding of the timing of the cash flows. The entity has to<br />
disclose a maturity analysis of financial assets it holds for managing liquidity risk, if that information is necessary to<br />
enable users of its financial statements to evaluate the nature and extent of liquidity risk. The adoption of the amendment<br />
results in additional disclosures but does not have an impact on the Fund’s net assets.<br />
• IAS 40, ‘Investment property’, amendment (and consequential amendment to IAS 16, ‘Property, plant and equipment’).<br />
The amendments are part of the IASB’s annual improvements project published in May 2008 and are effective from<br />
1 January 2009. Property that is under construction or development for future use as investment property is brought<br />
within the scope of IAS 40. Where the fair value model is applied, such property is measured at fair value. However,<br />
where fair value of investment property under construction is not reliably determinable, the property is measured at<br />
cost until the earlier of the date construction is completed and the date at which fair value becomes reliably measurable.<br />
Since at balance sheet date no property under construction was held by the Fund, the adoption had no impact<br />
on its net assets.<br />
• IFRIC 15, ‘Agreements for the construction of real estate’ (effective from January 1, 2009): The interpretation clarifies<br />
whether IAS 18, ‘Revenue’ or IAS 11 ‘Construction contracts’ should be applied to particular transactions. It<br />
is likely to result in IAS 18 being applied to a wider range of transactions. The management of the Fund expects to<br />
apply IAS 18 for such sale agreements; however, IFRIC 15 is currently not relevant to the Fund’s operations, as it has<br />
not yet entered into any sale agreements for the property under development classified as inventories.
<strong>Commerz</strong> <strong>Real</strong> Estate Master FCP – SIF<br />
NOTES TO THE CONSOLIDATED FINANCIAL STATEMENTS<br />
AS AT DECEMBER 31, 2009<br />
2.1. Basis of preparation (continued)<br />
• Improvements to IFRS’ (issued in May 2008): The Improvements project contains numerous amendments to IFRS<br />
that the IASB considers non-urgent but necessary. ‘Improvements to IFRS’ comprise amendments that result in<br />
accounting changes for presentation, recognition or measurement purposes, as well as terminology or editorial<br />
amendments related to a variety of individual IFRS standards. Most of the amendments are effective for annual<br />
periods beginning on or after January 1, 2009. No material changes to accounting policies arose as a result of these<br />
amendments except to the amendments to IAS 40, ‘Investment property’ (see above).<br />
(b) Interpretations and amendments to standards becoming effective in 2009 but not relevant for the Fund<br />
Financial Statements<br />
Standard/ Content Applicable for financial<br />
Interpretation years beginning on / after<br />
IFRS 1 and IAS 27 Cost of an investment in a subsidiary, jointly<br />
controlled entity or associate.<br />
January 1, 2009<br />
IFRS 2 Share-based payments – Vesting conditions<br />
and cancellations.<br />
January 1, 2009<br />
IFRS 8 Presentation of segment reporting January 1, 2009<br />
IFRIC 13 Customer loyalty programs July 1, 2008<br />
IFRIC 16 Hedges of a net investment in a foreign operation October 1, 2008<br />
(c) Standards and amendments, and interpretations that are not effective and not expected to have significant impact on the<br />
Fund’s financial statements<br />
Standard/ Content Applicable for financial<br />
Interpretation years beginning on / after<br />
IAS 27 Consolidation and separate financial statements July 1,2009<br />
IFRS 3 Business combinations July 1, 2009<br />
IFRS 9 Financial instruments: Classification and measurement January 1, 2013<br />
IAS 24 Related party disclosures January 1, 2011<br />
IAS 32 Classification of rights issues February 1, 2010<br />
IAS 39 Financial instruments: Recognition and measurement –<br />
Eligible hedged items<br />
July 1, 2009<br />
IFRS 1 First time adoption of International Financial Reporting Standards July 1, 2009<br />
Amendment Additional exemptions for first time adopters January 1, 2010<br />
Amendment Group cash settled share based payment transactions January 1, 2010<br />
IFRIC 17 Distribution of non-cash assets to owners July 1, 2009<br />
IFRIC 18 Transfer of assets from customers July 1, 2009<br />
71
72<br />
<strong>Commerz</strong> <strong>Real</strong> Estate Master FCP – SIF<br />
NOTES TO THE CONSOLIDATED FINANCIAL STATEMENTS<br />
AS AT DECEMBER 31, 2009<br />
2.1. Basis of preparation (continued)<br />
• IAS 27, ‘Consolidated and separate financial statements’ (revised 2008; effective for annual periods beginning on or<br />
after July 1, 2009). The revised standard requires the effects of all transactions with non-controlling interests to be<br />
recorded in equity if there is no change in control and these transactions will no longer result in goodwill or gains<br />
and losses. The standard also specifies the accounting when control is lost. Any remaining interest in the entity is<br />
re-measured to fair value and a gain or loss is recognised in profit or loss.<br />
• IFRS 3, ‘Business combinations’ (revised 2008; effective for business combinations for which the acquisition date<br />
is on or after the beginning of the first annual reporting period beginning on or after July 1, 2009). The revised<br />
standard continues to apply the acquisition method to business combinations, with some significant changes. For<br />
example, all payments to purchase a business are to be recorded at fair value at the acquisition date, with contingent<br />
payments classified as debt subsequently re-measured through the income statement. There is a choice on an<br />
acquisition-by-acquisition basis to measure the non-controlling interest in the acquiree either at fair vale or at the<br />
non-controlling interest’s proportionate share of the acquiree’s net assets. All acquisition-related costs should be<br />
expensed. The management of the Fund will apply the revised standard prospectively to all business combinations<br />
from 1 January 2010.<br />
• IFRS 9, ‘Financial instruments: Classification and measurement’. In November 2009, the Board issued the first part of<br />
IFRS 9 relating to the classification and measurement of financial assets. IFRS 9 will ultimately replace IAS 39. The<br />
standard requires an entity to classify its financial assets on the basis of the entity’s business model for managing<br />
the financial assets and the contractual cash flow characteristics of the financial asset, and subsequently measures<br />
the financial assets as either at amortised cost or fair value. The new standard is mandatory for annual periods<br />
beginning on or after January 1, 2013.<br />
(d) Early adoption of standards<br />
In 2009, the Group did not early adopt any new or amended standards and do not plan to early adopt any of the standards<br />
issued not yet effective.<br />
2.2. Consolidation<br />
The audited consolidated financial statements include the accounts of the Fund and its wholly owned subsidiaries (the<br />
“Group”).<br />
Subsidiaries are all entities (including special purpose entities) over which the Group has the power to govern the<br />
financial and operating policies generally accompanying a shareholding of more than one half of the voting rights. The<br />
existence and effect of potential voting rights that are currently exercisable or convertible are considered when assessing<br />
whether the Group controls another entity.<br />
Joint control is the contractually agreed sharing of control over an economic activity. There are no jointly controlled<br />
entities within the Group.
<strong>Commerz</strong> <strong>Real</strong> Estate Master FCP – SIF<br />
NOTES TO THE CONSOLIDATED FINANCIAL STATEMENTS<br />
AS AT DECEMBER 31, 2009<br />
2.2. Consolidation (continued)<br />
Financial Statements<br />
An associate is an entity, including an unincorporated entity such as a partnership, over which the investor has significant<br />
influence and that is neither a subsidiary nor an interest in a joint venture. No consolidated entity holds interests in<br />
any associate.<br />
Subsidiaries have been fully consolidated from the date on which control was transferred to the Group. They are deconsolidated<br />
from the date control ceases.<br />
Accounting for business combinations under IFRS 3 only applies if it is considered that a business has been acquired.<br />
Under IFRS 3, ‘Business combinations’, a business is defined as an integrated set of activities and assets conducted and<br />
managed for the purpose of providing a return to investors or lower costs or other economic benefits directly and proportionately<br />
to policyholders or participants. A business generally consists of inputs, processes applied to those inputs,<br />
and resulting outputs that are, or will be, used to generate revenues. In the absence of such criteria, a group of assets is<br />
deemed to have been acquired. If goodwill is present in a transferred set of activities and assets, the transferred set is<br />
presumed to be a business.<br />
For acquisitions meeting the definition of a business, the purchase method of accounting is used. The cost of an acquisition<br />
is measured as the fair value of the assets given, equity instruments issued and liabilities incurred or assumed at<br />
the date of exchange, plus costs directly attributable to the acquisition. Identifiable assets acquired and liabilities and<br />
contingent liabilities assumed in a business combination are measured initially at their fair values at the acquisition<br />
date, irrespective of the extent of any minority interest. The excess of the cost of acquisition over the fair value of the<br />
Group’s share of the identifiable net assets acquired is recorded as goodwill. If the cost of acquisition is less than the<br />
fair value of the Group’s share of the net assets acquired, the difference is recognised directly in the profit or loss for the<br />
year as negative goodwill.<br />
For acquisitions not meeting the definition of a business, the Group allocates the cost between the individual identifiable<br />
assets and liabilities in the Group based on their relative fair values at the date of acquisition. Such transactions or<br />
events do not give rise to goodwill.<br />
All the Group companies have December 31 as their year end. Consolidated financial statements are prepared using uniform<br />
accounting policies for like transactions. Accounting policies of subsidiaries have been changed where necessary<br />
to ensure consistency with the policies adopted by the Group.<br />
Intercompany transactions, balances and unrealized gains on transactions between group companies are eliminated.<br />
Unrealised losses are also eliminated unless the transaction provides evidence of an impairment of the asset transferred.<br />
The Group applies a policy of treating transactions with non-controlling interests as transactions with parties external<br />
to the Group. Non-controlling interests represent the portion of profit and net assets not held by the Group. They are<br />
presented separately in the statement of comprehensive income and in the consolidated statement of financial position<br />
separately from the amounts attributable to the owners of the parent. At year end, no non-controlling interest exists.<br />
73
74<br />
<strong>Commerz</strong> <strong>Real</strong> Estate Master FCP – SIF<br />
NOTES TO THE CONSOLIDATED FINANCIAL STATEMENTS<br />
AS AT DECEMBER 31, 2009<br />
2.3. Investment Property<br />
Property that is held for long-term rental yields or for capital appreciation or both, and that is not occupied by the Fund<br />
or its subsidiaries is classified as investment property. As from January 1, 2009, investment property also includes property<br />
that is being constructed or developed for future use as investment property.<br />
Land held under operating leases is classified and accounted for by the Group as investment property when the rest of<br />
the definition of investment property is met. The operating lease is accounted for as if it were a finance lease.<br />
Investment property is measured initially at its cost, including related transaction costs and borrowing costs, if applicable.<br />
Borrowing costs are incurred for the purpose of acquiring, constructing or producing a qualifying investment<br />
property are capitalised as part of its cost. Borrowing costs are capitalised while acquisition or construction is actively<br />
underway and cease once the asset is substantially complete, or suspended if the development of the asset is suspended.<br />
After initial recognition, investment property is carried at fair value. Fair value is based on active market prices,<br />
adjusted, if necessary, for any difference in the nature, location or condition of the specific asset. If this information is<br />
not available, the Group uses alternative valuation methods such as recent prices on less active markets or discounted<br />
cash flow projections. Valuations are performed as of the financial position date by professional external valuers who<br />
hold recognised and relevant professional qualifications and have recent experience in the location and category of the<br />
investment property being valued. These valuations form the basis for the carrying amounts in the financial statements.<br />
Investment property that is being redeveloped for continuing use as investment property or for which the market has<br />
become less active continues to be measured at fair value. As at reporting date, there had been no properties under<br />
development held by the Group.<br />
Valuations of investment property are performed in accordance with the guidance issued by the International Valuation<br />
Standards Committee.
<strong>Commerz</strong> <strong>Real</strong> Estate Master FCP – SIF<br />
NOTES TO THE CONSOLIDATED FINANCIAL STATEMENTS<br />
AS AT DECEMBER 31, 2009<br />
2.3. Investment Property (continued)<br />
The fair value of investment property reflects, among other things, rental income from current leases and assumptions<br />
about rental income from future leases in the light of the current market conditions.<br />
The fair value also reflects, on a similar basis, any cash outflows that could be expected in respect of the property. Some<br />
of those outflows are recognised as a liability, including finance lease liabilities in respect of leasehold land classified as<br />
investment property; others, including contingent rent payments, are not recognised in the financial statements.<br />
Subsequent expenditure is capitalised to the asset’s carrying amount only when it is probable that future economic<br />
benefits associated with the expenditure will flow to the Group and the cost of the item can be measured reliably. All<br />
other repairs and maintenance costs are expensed when incurred. When part of an investment property is replaced, the<br />
carrying amount of the replaced part is derecognised.<br />
If a valuation obtained for a property held under a lease is net of all payments expected to be made, any related lease<br />
liability recognised separately in the statement of financial position is added back to arrive at the carrying value of the<br />
investment property for accounting purposes.<br />
The fair value of investment property does not reflect future capital expenditure that will improve or enhance the<br />
property and does not reflect the related future benefits from this future expenditure other than those a rational market<br />
participant would take into account when determining the value of the property.<br />
<strong>Commerz</strong> Grundbesitzgesellschaft mbH (“<strong>CG</strong>G”, now <strong>Commerz</strong> <strong>Real</strong> AG) engaged BDO Deutsche Warentreuhand AG<br />
(“BDO”), an audit company not affiliated with <strong>CG</strong>G, to supervise and monitor the valuation process. BDO selected, in its<br />
own discretion, three Independent Valuers:<br />
Cushman & Wakefield LLP<br />
(“Cushman & Wakefield”)<br />
Westhafenplatz 6<br />
D- 60327 Frankfurt am Main,<br />
Germany<br />
DTZ Ibérica (“DTZ”)<br />
Paseo de la Castellana 93 – 2a planta<br />
28036 Madrid<br />
Spain<br />
DTZ Portugal (“DTZ”)<br />
Rua Tierno Galvan, Torre 3, 16º Piso<br />
1070-274 Lisboa<br />
Portugal<br />
Financial Statements<br />
75
76<br />
<strong>Commerz</strong> <strong>Real</strong> Estate Master FCP – SIF<br />
NOTES TO THE CONSOLIDATED FINANCIAL STATEMENTS<br />
AS AT DECEMBER 31, 2009<br />
2.3. Investment Property (continued)<br />
Changes in fair values are recorded in the statement of comprehensive income. Investment properties are derecognised<br />
either when they have been disposed of or when the investment property is permanently withdrawn from use and no<br />
future economic benefit is expected from its disposal.<br />
Where the Group disposes of a property at fair value in an arm’s length transaction, the carrying value immediately<br />
prior to the sale is adjusted to the transaction price, and the adjustment is recorded in the income statement within net<br />
gain from fair value adjustment on investment property.<br />
Investment properties under construction will be, if applicable, shown as investment properties. They will subsequently<br />
be valued at the fair value at each reporting date. All fair value gains or losses will be recognised as profit or loss for the<br />
year as fair value gains or losses.<br />
If an investment property becomes owner-occupied, it is reclassified as property, plant and equipment. Its fair value at<br />
the date of reclassification becomes its cost for subsequent accounting purposes.<br />
If an item of owner-occupied property becomes an investment property because its use has changed, any difference<br />
resulting between the carrying amount and the fair value of this item at the date of transfer is treated in the same way<br />
as a revaluation under IAS 16. Any resulting increase in the carrying amount of the property is recognised in the profit<br />
or loss to the extent that it reverses a previous impairment loss, with any remaining increase recognised in other comprehensive<br />
income and increases directly to revaluation surplus within equity. Any resulting decrease in the carrying<br />
amount of the property is initially charged in other comprehensive income against any previously recognised revaluation<br />
surplus, with any remaining decrease charged to profit or loss.<br />
Where an investment property undergoes a change in use, evidenced by commencement of development with a view to<br />
sale, the property is transferred to inventories. A property’s deemed cost for subsequent accounting as inventories is its<br />
fair value at the date of change in use.<br />
2.4 Financial instruments<br />
(a) Financial assets<br />
Financial assets are classified as financial assets at fair value through profit or loss, loans and receivables, held-to-maturity<br />
financial assets, and available-for-sale financial assets, as appropriate. The Group determines the classification of<br />
its financial assets at initial recognition. When financial assets are recognised initially, they are measured at fair value,<br />
plus, in the case of investments not at fair value through profit or loss, directly attributable transaction costs. Financial<br />
assets are derecognised only when the contractual rights to the cash flows from the financial asset expire or the Group<br />
transfers substantially all risks and rewards of ownership.<br />
The Group’s financial assets consist only of loans and receivables.
<strong>Commerz</strong> <strong>Real</strong> Estate Master FCP – SIF<br />
NOTES TO THE CONSOLIDATED FINANCIAL STATEMENTS<br />
AS AT DECEMBER 31, 2009<br />
2.4 Financial instruments (continued)<br />
Financial assets recognised in the statement of financial position as trade and other receivables are classified as loans<br />
and receivables. They are recognised initially at fair value and subsequently measured at amortised cost less provision<br />
for impairment.<br />
Cash and cash equivalents are also classified as loans and receivables. They are subsequently measured at amortised<br />
cost. Cash and cash equivalents includes cash in hand, deposits held at call with banks and other short-term highly<br />
liquid investments with original maturities of three months or less.<br />
The Group assesses at each financial position date whether there is objective evidence that a financial asset or group of<br />
financial assets is impaired. If there is objective evidence (such as significant financial difficulty of the obligor, breach<br />
of contract, or it becomes probable that the debtor will enter bankruptcy) the asset is tested for impairment. The amount<br />
of the loss is measured as the difference between the asset’s carrying amount and the present value of estimated future<br />
cash flows (excluding future expected credit losses that have not been incurred) discounted at the financial asset’s original<br />
effective interest rate (that is, the effective interest rate computed at initial recognition). The carrying amount of<br />
the asset is reduced through use of an allowance account. The amount of the loss is recognised as profit or loss.<br />
In relation to trade receivables, a provision for impairment is made when there is objective evidence (such as the probability<br />
of insolvency or significant financial difficulties of the debtor) that the Group will not be able to collect all of the amounts<br />
due under the original terms of the invoice. Impaired debts are derecognised when they are assessed as uncollectible.<br />
If in a subsequent period the amount of the impairment loss decreases and the decrease can be related objectively to an<br />
event occurring after the impairment was recognised, the previously recognised impairment loss is reversed, to the extent<br />
that the carrying value of the asset does not exceed its amortised cost at the reversal date. Any subsequent reversal<br />
of an impairment loss is recognised as profit or loss.<br />
(b) Financial liabilities<br />
Liabilities within the scope of IAS 39 are classified as financial liabilities at fair value through profit or loss or other<br />
liabilities, as appropriate.<br />
A financial liability is derecognised when the obligation under the liability is discharged or cancelled or expires.<br />
All loans and borrowings are classified as other liabilities. Initial recognition is at fair value less directly attributable<br />
transaction costs. After initial recognition, interest bearing loans and borrowings are subsequently measured at amortised<br />
cost using the effective interest method (see Note 2.11 for the accounting policy on borrowings).<br />
Financial liabilities included in trade and other payables are recognised initially at fair value and subsequently at amortised<br />
cost. The fair value of a non-interest bearing liability is its discounted repayment amount. If the due date of the<br />
liability is less than one year, discounting is omitted.<br />
2.5. Cash and cash equivalents<br />
Financial Statements<br />
Cash and cash equivalents comprise cash in hand, deposits held at call with banks, other short- term highly liquid investments<br />
with original maturities of three months or less, and bank overdrafts.<br />
77
78<br />
<strong>Commerz</strong> <strong>Real</strong> Estate Master FCP – SIF<br />
NOTES TO THE CONSOLIDATED FINANCIAL STATEMENTS<br />
AS AT DECEMBER 31, 2009<br />
2.6. Prepayments<br />
Prepayments are carried at cost less any accumulated impairment losses. See Note 2.7 for separate accounting policy<br />
for pre-paid operating lease payments.<br />
2.7. Leases<br />
Properties leased under operating leases are included in investment property in the consolidated statement of financial<br />
position (note 5). See note 2.14. for the recognition of rental income.<br />
2.8. Trade receivables<br />
Trades receivables are recognised initially at fair value and subsequently measured at amortised cost using the effective<br />
interest method, less provision for impairment. A provision for impairment of trade receivables is established when there<br />
is objective evidence that the Group will not be able to collect all amounts due according to the original terms of the<br />
receivables. Significant financial difficulties of the debtor, probability that the debtor will enter bankruptcy or financial<br />
reorganisation, and default or delinquency in payments (more than 30 days overdue) are considered indicators that the<br />
trade receivable is impaired. The amount of provision is the difference between the asset’s carrying amount and the<br />
present value of estimated future cash flows, discounted at the original effective interest rate. The carrying amount of<br />
the asset is reduced through the use of an allowance account, and the amount of the loss is recognised in the income<br />
statement. When a trade receivable is uncollectible, it is written off against the allowance account for trade receivables.<br />
Subsequent recoveries of amounts previously written off are recognised as profit or loss.<br />
2.9. Share capital<br />
Shares are classified as equity when there is no obligation to transfer cash or other assets. Incremental costs directly<br />
attributable to the issue of new shares are shown in equity as a deduction, net of tax, from the proceeds.<br />
2.10. Trade and other payables<br />
Trade and other payables are recognised initially at fair value and subsequently measured at amortised cost using the<br />
effective interest method.<br />
Certain group companies obtain deposits from tenants as a guarantee for returning the property at the end of the lease<br />
term in a specified good condition or for the lease payments for a period ranging from 1 to 12 months. Such deposits are<br />
treated as financial liabilities in accordance with IAS 39 and they are initially recognised at fair value. The difference<br />
between fair value and cash received is considered to be part of the minimum lease payments received for the operating<br />
lease (refer to note 2.14. for the recognition of rental income). The deposit is subsequently measured at amortised cost.
<strong>Commerz</strong> <strong>Real</strong> Estate Master FCP – SIF<br />
NOTES TO THE CONSOLIDATED FINANCIAL STATEMENTS<br />
AS AT DECEMBER 31, 2009<br />
2.11. Borrowings<br />
Borrowings are recognized initially at fair value, net of transaction costs incurred. Borrowings are subsequently stated<br />
at amortized cost; any difference between the proceeds (net of transaction costs) and the redemption value is recognized<br />
as finance cost in the statement of comprehensive income over the period of the borrowings using the effective<br />
interest method.<br />
Fees paid on the establishment of loan facilities are recognised as transaction costs of the loan to the extent that it is<br />
probable that some or all of the facility will be drawn down. In this case, the fee is deferred until the draw-down occurs.<br />
To the extent there is no evidence that it is probable that some or all of the facility will be drawn down, the fee is capitalised<br />
as a prepayment for liquidity services and amortised over the period of the facility to which it relates.<br />
Borrowings are classified as current liabilities unless the Group has an unconditional right to defer settlement of the<br />
liability for at least 12 months after the date of the statement of financial position.<br />
2.12. Current and deferred income tax<br />
Financial Statements<br />
Tax expense comprises current and deferred tax. Tax is recognised in the income statement, except to the extent that it<br />
relates to items recognised directly in equity, in which case the tax is also recognised in equity.<br />
The current income tax charge is calculated on the basis of the tax laws enacted or substantively enacted at the date of<br />
the statement of financial position in the countries where the Group operates. Management periodically evaluates positions<br />
taken in tax returns with respect to situations in which applicable tax regulation is subject to interpretation, and<br />
establishes provisions where appropriate on the basis of amounts expected to be paid to the tax authorities.<br />
Deferred income tax is provided in full, using the liability method, on temporary differences arising between the tax<br />
bases of assets and liabilities and their carrying amounts in the consolidated financial statements. However, the deferred<br />
income tax is not accounted for if it arises from initial recognition of an asset or liability in a transaction other than<br />
a business combination that at the time of the transaction affects neither accounting or taxable profit or loss. Deferred<br />
income tax is determined using rates (and laws) which have been enacted or substantially enacted by the balance sheet<br />
date and are expected to apply when the related deferred income tax asset is realised or the deferred income tax liability<br />
is settled. Deferred income tax assets are recognised to the extent that it is probably that future taxable profit will be<br />
available against which the temporary differences can be utilised.<br />
The carrying value of the Group’s investment property will generally be realised by a combination of income (rental<br />
stream during the period of use) and capital (the consideration on the sale at the end of use). In jurisdictions where different<br />
tax rates exist for income and capital gains, the Group considers the planned recovery of the asset and how that<br />
affects the tax rate used in the calculation of the deferred tax. The length of the period for which a property will be held<br />
prior to disposal is based on the Group’s current plans and recent experience with similar properties. The capital gains<br />
tax rate applied is that which would apply on a direct sale of the property recorded in the statement of financial position,<br />
regardless of whether the Group would structure the sale via the disposal of the subsidiary holding the asset, to which a<br />
different tax rate may apply.<br />
79
80<br />
<strong>Commerz</strong> <strong>Real</strong> Estate Master FCP – SIF<br />
NOTES TO THE CONSOLIDATED FINANCIAL STATEMENTS<br />
AS AT DECEMBER 31, 2009<br />
2.12. Current and deferred income tax<br />
The deferred tax is then calculated based on the respective temporary differences and tax consequences arising from<br />
recovery through use and recovery through sale.<br />
Deferred income tax is provided on temporary differences arising on investments in subsidiaries and associates, except<br />
where the timing of the reversal of the temporary difference is controlled by the Group and it is probable that the temporary<br />
difference will not reverse in the foreseeable future.<br />
2.13. Provisions<br />
Provisions for legal claims are recognised when the Group has a present legal or constructive obligation as a result of<br />
past events; it is probable that an outflow of resources will be required to settle the obligation; and the amount can be<br />
reliably estimated.<br />
Provisions are measured at the present value of the expenditures expected to be required to settle the obligation using<br />
a pre-tax rate that reflects current market assessments of the time value of money and the risks specific to the obligation.<br />
The increase in the provision due to passage of time is recognised as finance cost.<br />
Where the Group, as lessee, is contractually required to restore a leased property to an agreed condition prior to release<br />
by a lessor, provision is made for such costs as they are identified.<br />
2.14. Revenue recognition<br />
Revenue includes rental income, service charges and management charges from properties<br />
Rental income from operating leases is recognized in income on a straight-line basis over the lease term. When the<br />
Fund provides incentives to its customers, the cost of incentives are recognized over the lease term, on a straight-line<br />
basis, as a reduction of rental income.<br />
Service and management charges are recognized on a gross basis in the accounting period in which the services are<br />
rendered. When the Fund is acting as an agent, the commission rather than gross income is recorded as revenue.<br />
2.15. Dividend distribution<br />
Dividend distribution to the Company’s shareholders is recognised as a liability in the Group’s statement of financial position<br />
in the period in which the dividends are approved.<br />
2.16. Expenses<br />
Expenses are recognised on an accrual basis in the period to which the expense can be contractually recovered, net of<br />
any sales taxes.<br />
Expenses are accounted for on an accrual basis and are charged to the consolidated statement of comprehensive income<br />
in the period to which they relate with the exception of expenditures which can be directly attributed to the acquisition<br />
of an asset which is then capitalised as a component of cost. Expenses arising from the disposal of assets will be deducted<br />
from the proceeds of disposal.
<strong>Commerz</strong> <strong>Real</strong> Estate Master FCP – SIF<br />
NOTES TO THE CONSOLIDATED FINANCIAL STATEMENTS<br />
AS AT DECEMBER 31, 2009<br />
2.17. Interest income and expense<br />
Interest income and expense are recognised within ‘finance income’ and ‘finance costs’ in the consolidated statement of<br />
comprehensive income using the effective interest rate method, except for borrowing costs relating to qualifying assets,<br />
which from January 1, 2009 are capitalised as part of the cost of that asset. The Group has chosen to capitalise borrowing<br />
costs on all qualifying assets irrespective of whether they are measured at fair value.<br />
The effective interest method is a method of calculating the amortized cost of a financial asset or financial liability and<br />
of allocating the interest income or interest expense over the relevant period. The effective interest rate is the rate that<br />
exactly discounts future cash payments or receipts throughout the expected life of the financial instrument, or a shorter<br />
amount where appropriate to the net carrying amount of the financial asset or liability. When calculating the effective<br />
interest rate, the Management estimates cash flows considering the contractual terms of the financial instrument (for<br />
example, prepayments, options) but does not consider future credit losses. The calculation includes all fees and points<br />
paid or received between parties to the contract that are an integral part of the effective interest rate, transaction costs<br />
and all other premiums or discounts.<br />
2.18. Other direct property operating expenses<br />
Other direct property operating expenses comprise the costs of owning and managing properties, such as service charges<br />
and maintenance costs. Where a property or a part of a property is unoccupied, these costs are attributable to the<br />
Fund, if not covered by rental guarantees.<br />
2.19. Other expenses<br />
Expenses include legal, accounting, auditing and other fees. They are recognised as expense in profit or loss in the period<br />
in which they are incurred (on an accruals basis).<br />
2.20. Foreign currency transactions<br />
The Fund’s and all sub- entities’ functional and reporting currency is Euro. All transactions were in Euro (“EUR”,<br />
“Euro”). No cash positions were held in any other currency except for Euros. Since all investments by the Group as at<br />
reporting date were held within the Euro- Zone foreign currency translation is not necessary.<br />
2.21. Comparatives<br />
Financial Statements<br />
The disclosure of certain figures for the year ended December 31, 2008, has been reclassified in order to ensure comparability<br />
with the figures for the year ended December 31, 2009. The reclassification was done to take into account the<br />
changes resulting from the amendment of IAS 1 and to reflect changes in allocation of operational costs.<br />
81
82<br />
<strong>Commerz</strong> <strong>Real</strong> Estate Master FCP – SIF<br />
NOTES TO THE CONSOLIDATED FINANCIAL STATEMENTS<br />
AS AT DECEMBER 31, 2009<br />
3. Financial risk management<br />
3.1. Financial risk factors<br />
The risk management function within the Group is carried out in respect of financial risks. Financial risks are risks<br />
arising from financial instruments to which the Group is exposed during or at the end of the reporting period. Financial<br />
risk comprises market risk (including currency risk, interest rate risk and other price risk), credit risk and liquidity risk.<br />
The primary objectives of the financial risk management function are to establish risk limits, and then ensure that exposure<br />
to risks stays within these limits.<br />
Risk management is carried out by the financial controller of the Group under policies approved by the Board of Directors.<br />
The fund controller identifies and evaluates financial risks in close co-operation with the Group’s operating units.<br />
The Board provides written principles for overall risk management, as well as written policies covering specific areas,<br />
such as interest rate risk, credit risk, and investing excess liquidity.<br />
Key financial risk management reports are produced monthly on a Group level and provided to the key management<br />
personnel of the Fund.<br />
The Group’s activities expose it to a variety of financial risks, including; market risk (including fair value interest rate<br />
risk, cash flow interest rate risk and price risk), credit risk and liquidity risk. This note presents information about the<br />
Group’s exposure to each of the above risks, the Group’s objectives, policies and processes for measuring and managing<br />
risk, and the Group’s management of capital.<br />
The financial risks are related to the following financial instruments: trade receivables, cash and cash equivalents, trade<br />
and other payables and borrowings.<br />
(a) Market risk<br />
Market risk is the risk that the fair value or future cash flows of a financial instrument will fluctuate because of changes<br />
in market prices. The Group’s market risks arise from open positions in interest-bearing assets and liabilities, to the<br />
extent that these are exposed to general and specific market movements. Management sets limits on the exposure to<br />
interest rate risk that may be accepted, which are monitored on a monthly basis. However, the use of this approach does<br />
not prevent losses outside of these limits in the event of more significant market movements. Currently the Group is not<br />
exposed to market risk with respect to financial instruments as it does not hold any equity securities.<br />
Sensitivities to market risks included below are based on a change in one factor while holding all other factors constant.<br />
In practice this is unlikely to occur, and changes in some of the factors may be correlated – for example, changes in<br />
interest rates and changes in currency rates.<br />
(i) Price risk<br />
The Group has no significant exposure to price risk as it does not hold any equity securities or commodities.<br />
The Group is exposed to price risk other than in respect of financial instruments, such as property price risk including<br />
property rentals risk (note 5).
<strong>Commerz</strong> <strong>Real</strong> Estate Master FCP – SIF<br />
NOTES TO THE CONSOLIDATED FINANCIAL STATEMENTS<br />
AS AT DECEMBER 31, 2009<br />
3.1. Financial risk factors (continued)<br />
The Group is exposed to property price and property rental risk. The Management of the Fund seeks to create a portfolio<br />
that generates sustainable current income and provides investors with long-term appreciation of asset values. The<br />
Fund’s main investment goal is to invest exclusively in dominant regional shopping centres with the aim of creating a<br />
Portfolio diversified both by geography, with a focus on core markets, and by real estate type with a focus on stabilised<br />
assets. Dominant regional shopping centres can create a quasi-natural monopoly within their respective catchment<br />
area. Their size allows for configuration of an optimal branch and tenant mix, which is the key to maintaining competitiveness<br />
in a fast changing retailers’ landscape. The geographic allocation of the investments is split in core and<br />
emerging markets, with approximately 70% of investments targeted in core markets and the remaining 30% invested<br />
in emerging markets. These splits will offer both upside potential for the investor while at the same time maintaining<br />
the cash flow profile of a core product.<br />
(ii) Cash flow and fair value interest rate risk<br />
As the Group has no significant interest bearing assets, its income and operating cash flows are substantially independent<br />
of changes in market interest rates.<br />
The Group’s possible interest rate risk on interest payable arises from long-term borrowings (Note 8). Borrowings issued<br />
at variable rates expose the Group to cash flow interest rate risk. Since all long-term borrowings are issued with fixed<br />
interest rates, changes in market interest rates will as at December 31, 2009 not effect the Group to cash flow interest<br />
rate risk. Nevertheless the Group has significant exposure to fair value interest rate risk.<br />
(iii) Foreign currency risk<br />
The Group has no exposure to foreign currency risks as all transactions are denominated in Euro<br />
(b) Credit risk<br />
Financial Statements<br />
Credit risk is the risk that one party to a financial instrument will cause a financial loss for the other party by failing<br />
to discharge an obligation. The Group has no significant concentrations of credit risk. Credit risk arises from cash and<br />
cash equivalents held at banks and trade receivables, including rental receivables from lessees. Credit risk is managed<br />
on a group basis. The Group structures the levels of credit risk it accepts by placing limits on its exposure to a single<br />
counterparty, or groups of counterparties, and to geographical and industry segments.<br />
83
84<br />
<strong>Commerz</strong> <strong>Real</strong> Estate Master FCP – SIF<br />
NOTES TO THE CONSOLIDATED FINANCIAL STATEMENTS<br />
AS AT DECEMBER 31, 2009<br />
3.1. Financial risk factors (continued)<br />
Such risks are subject to a quarterly or more frequent review. The Group has policies in place to ensure that rental contracts<br />
are made with customers with an appropriate credit history. Cash balances are held only with financial institutions<br />
with a Moody’s credit rating of A or better. The Group has policies that limit the amount of credit exposure to any<br />
financial institution. Limits on the level of credit risk by category and territory are approved quarterly by the Board of<br />
Directors. The utilisations of credit limits are regularly monitored.<br />
The Group’s maximum exposure to credit risk by class of financial asset is as follows:<br />
(c) Liquidity risk<br />
Prudent liquidity risk management implies maintaining sufficient cash and the availability of funding through an adequate<br />
amount of committed credit facilities and the ability to close out market positions. The Fund’s main investment<br />
goal is to create a portfolio which guarantees stable cash flows through geographic and investment product diversification.<br />
The Group’s liquidity positions are monitored on a daily basis by management and are reviewed by the Board of Directors.<br />
A summary table with maturity of financial assets and liabilities is presented below. This is used by key management<br />
personnel to manage liquidity risks and is derived from managerial reports at company level. Undiscounted cash<br />
flows in respect of balances due within 12 months generally equal their carrying amounts in the statement of financial<br />
position as the impact of discounting is not significant.
<strong>Commerz</strong> <strong>Real</strong> Estate Master FCP – SIF<br />
NOTES TO THE CONSOLIDATED FINANCIAL STATEMENTS<br />
AS AT DECEMBER 31, 2009<br />
3.1. Financial risk factors (continued)<br />
Financial Statements<br />
The following tables summarise the liquidity gaps split by residual maturities as at December 31, 2008 and December<br />
31, 2009:<br />
Liquidity risks may also stem from derivative instruments held by the Fund. The Management will in general not provide<br />
for currency hedging on <strong>CG</strong> <strong>malls</strong> <strong>europe</strong>’s level and will under no circumstances use derivatives for speculative purposes.<br />
Nevertheless, the Fund Management has full discretion to use futures, options or other derivatives for selective<br />
hedging purposes to mitigate currency and/or interest rate risks. At reporting date the fund did not hold any derivatives<br />
instruments.<br />
Liquidity risks for the Fund might also stem from the redemption of units of the Fund’s investors. Each investor has<br />
the right to have its units redeemed, subject to the Fund’s notice period, with the notice period varying between three<br />
and thirty months. The redemption price shall equal the NAV per Unit at the time the redemption becomes effective.<br />
In order to fund redemptions, the Management Company may use funds that would otherwise constitute distributable<br />
cash flow, call undrawn capital commitments, sell assets belonging to <strong>CG</strong> <strong>malls</strong> <strong>europe</strong> (including real estate), incur<br />
debt subject to the prescribed borrowing restrictions or use available funds from other sources. At reporting date no<br />
redemptions were issued.<br />
85
86<br />
<strong>Commerz</strong> <strong>Real</strong> Estate Master FCP – SIF<br />
NOTES TO THE CONSOLIDATED FINANCIAL STATEMENTS<br />
AS AT DECEMBER 31, 2009<br />
3.2. Capital risk management<br />
The Group’s objectives when managing capital are to safeguard the Group’s ability to continue as a going concern in order<br />
to provide returns for shareholders and benefits for other stakeholders and to maintain an optimal capital structure<br />
to reduce the cost of capital.<br />
In order to maintain or adjust the capital structure, the Group may adjust the amount of dividends paid to shareholders,<br />
return capital to shareholders, issue new shares or sell assets to reduce debt.<br />
Consistent with others in the industry, the Group monitors capital on the basis of the gearing ratio. This ratio is calculated<br />
as net debt divided by total capital. Net debt is calculated as total borrowings (including borrowings and trade and<br />
other payables, as shown in the consolidated balance sheet) less cash and cash equivalents. Total capital is calculated as<br />
equity, as shown in the consolidated balance sheet, plus net debt.<br />
The gearing ratio policy during 2009, which was unchanged from 2008, was restricted to the following: As set in the<br />
Private Placement Memorandum (Terms and Conditions of <strong>CG</strong> <strong>malls</strong> Europe) the Borrowing rate should on average over<br />
any fiscal year not exceed 60% of the market value of the investment properties. Furthermore, short-term borrowing<br />
entrance is limited up to 10% of the Gross Asset Value of the Group, mostly to satisfy short term liquidity requirements.<br />
As at December 31, 2009 the Fund’s overall gearing ratio was 66.92% (December 31, 2008: 61.62%). The gearing ratio<br />
includes two loan facilities that have been reclassified to short term liabilities because of covenant breaches or because<br />
of remaining time to maturity of one year or less. The management of the Fund is already engaged in negotiations<br />
concerning the extension/revision of both loan facilities and it estimates the probability of extending the loans to be<br />
very high. The average overall gearing ratio in 2009 was 64.62% (2008: 61.62%). Therefore the limit of a 60% average<br />
borrowing rate as set out in the management regulations could not be complied with.<br />
Since the recent negative market fluctuations which mainly caused the increase in the overall gearing ratio are considered<br />
to be temporarily and therefore the market values of the investment properties are expected to recover, the Fund is<br />
expecting to meet the target borrowing rate restrictions in the near future. Furthermore it is expected that all credit facilities<br />
currently disclosed as short term liabilities will be extended so that the gearing ratio for short term debt is expected<br />
to decrease to zero percent in the near future.<br />
The gearing ratios at the end of the reporting periods 2008 and 2009 were as follows:<br />
2009 2008<br />
in EUR in EUR<br />
Trade receivables, gross of provision for impairment (note 6)<br />
- Rent receivables 11,447,280 9,577,322<br />
- Other financial assets 11,258,612 9,589,337<br />
Prepayments (note 7) 5,087,085 4,900,497<br />
Cash and cash equivalents 20,714,230 24,556,946
<strong>Commerz</strong> <strong>Real</strong> Estate Master FCP – SIF<br />
NOTES TO THE CONSOLIDATED FINANCIAL STATEMENTS<br />
AS AT DECEMBER 31, 2009<br />
3.2. Capital risk management (continued)<br />
The debt to equity ratios at the end of the reporting period 2008 and 2009 were as follows:<br />
3.3. Fair value estimation<br />
Effective January 1, 2009, the Group adopted the amendment to IFRS 7 for financial instruments that are measured<br />
in the statement of financial position at fair value. This requires disclosure of fair value measurements by level of the<br />
following fair value measurement hierarchy:<br />
• Quoted prices (unadjusted) in active markets for identical assets or liabilities (level 1).<br />
• Inputs other than quoted prices included within level 1 that are observable for the asset or liability, either directly<br />
(that is, as prices) or indirectly (that is, derived from prices) (level 2).<br />
• Inputs for the asset or liability that are not based on observable market data (that is, unobservable inputs) (level 3).<br />
The Group does not hold any financial instruments measured at fair value.<br />
The carrying values less impairment provision of trade receivables and payables are approximate their fair values. The<br />
fair value of financial liabilities for disclosure purposes is estimated by discounting the future contractual cash flows at<br />
the current market interest rate that is available to the group for similar financial instruments.<br />
All loans held by the Group at the date of the statement of financial position are fixed interest rate borrowings with the<br />
book value being the amortized cost value. Over the past months market interest rates have been declining but at the<br />
same time also individual borrowing margins for the members of the Group have been increasing, almost completely<br />
offsetting the effect of decreased market rates. Thus the book values of the loans disclosed in the balance sheet can<br />
still be considered as the best estimate of their fair values. Nevertheless all else being equal, changes in market interest<br />
rates can have a significant impact on the fair value of the loans, exposing the Group to significant fair value interest<br />
rate risk.<br />
4. Critical accounting estimates and judgments<br />
4.1. Critical accounting estimates and assumptions<br />
Financial Statements<br />
Estimates and judgements are continually evaluated and are based on historical experience as adjusted for current<br />
market conditions and other factors.<br />
87
88<br />
<strong>Commerz</strong> <strong>Real</strong> Estate Master FCP – SIF<br />
NOTES TO THE CONSOLIDATED FINANCIAL STATEMENTS<br />
AS AT DECEMBER 31, 2009<br />
4.1. Critical accounting estimates and assumptions (continued)<br />
The preparation of the consolidated financial statements requires management to make estimates and assumptions that<br />
affect the reported amounts of assets and liabilities and disclosures of contingent assets and liabilities at the date of the<br />
financial statements and the reported amounts of revenue, expenses and unrealized gains or losses during the reporting<br />
period. Actual results could differ from these estimates. The significant accounting estimates for the Fund are described<br />
below:<br />
(a) Fair value of investment properties<br />
The fair value of investment property is the price at which the property could be exchanged between knowledgeable,<br />
willing parties in an arm’s length transaction. The fair value is determined without any deduction for transaction costs<br />
it may occur on sale or other disposal.<br />
The best estimate of fair value is current prices in an active market for similar lease and other contracts. In the absence<br />
of such information, the Group determines the amount within a range of reasonable fair value estimates and assumptions<br />
based on market conditions existing at each balance sheet date.<br />
The fair values of the properties are determined by the discounted cash flow method over a ten year period. The calculated<br />
amount is, amongst other factors, crucially dependant on assumptions on key factors concerning the net operating<br />
income, such as assumptions on general vacancy, collection losses, or on repair and maintenance costs as well as on<br />
general assumptions on the discount rate. Assumptions on these parameters differ significantly depending on jurisdiction,<br />
location or general state of condition of the specific property. Modifications in assumptions on any of these factors<br />
may lead to significant changes in the estimated market values.<br />
The Fund reviews and where appropriate challenges the fair market valuations provided by the independent valuers.<br />
In doing so, the Fund Managers use their knowledge and understanding of current prevailing market conditions and<br />
transactional activity obtained from a variety of other external sources.<br />
(b) Income taxes<br />
The Group is subject to income taxes in different jurisdictions. Significant estimates are required in determining the<br />
provision for income taxes. There are many transactions and calculations for which the ultimate tax determination is<br />
uncertain. The Group recognises liabilities that may arise from anticipated tax audits based on estimates of whether<br />
additional taxes will be due. Where the final tax outcome from these matters is different from the amounts that were<br />
initially recorded, such differences will impact the income tax and deferred tax provisions in the period in which such<br />
determination is made.<br />
4.2. Critical judgements in applying the Group’s accounting policies<br />
The Group did not make any critical accounting judgements in 2009 or 2008.
<strong>Commerz</strong> <strong>Real</strong> Estate Master FCP – SIF<br />
NOTES TO THE CONSOLIDATED FINANCIAL STATEMENTS<br />
AS AT DECEMBER 31, 2009<br />
5. Investment Properties<br />
Financial Statements<br />
On October 31, 2007 the Fund acquired two shopping centres, Forum Almada and Forum Montijo, both located south of<br />
Lisbon, Portugal, and the shopping centre Espacio León, located in Northern Spain, in the city of León (“Seed Portfolio”)<br />
from another fund managed by an entity of <strong>Commerz</strong> <strong>Real</strong> Group. The purchase price for investments acquired<br />
in 2007 was determined in accordance with the respective purchase agreements, and recorded accordingly. This also<br />
included the final purchase price adjustments recorded in 2008 for the investments acquired in 2007. The purchase price<br />
for investment property included equalisation for key money, tax effects, financing costs, and adjustments regarding<br />
“HIP”, a program related to the maintenance of the properties. Thus the initially recorded acquisition costs increased<br />
the fair value of the acquired property which was determined by the independent valuer. The below disclosed unrealised<br />
loss of 2007 was mainly influenced by this effect. In 2008 late adjustments on the purchase prices paid in 2007<br />
were paid, resulting in a further increase in the acquisition costs of EUR 277,882 in total. In 2009 no further acquisition<br />
costs in regards to the Seed Portfolio were incurred.<br />
During the financial year 2009 the Fund did not acquire any further real estate investments. The movements in the<br />
investment values in the properties held by the fund until December 31, 2009 are as follows:<br />
At December 31, 2009 and 2008, the Group had no unprovided contractual obligations for future repairs and maintenance.<br />
Direct operating expenses recognised in the statement of comprehensive income include EUR 751,784 (2008: EUR 0)<br />
relating to investment property that was unlet.<br />
89
90<br />
<strong>Commerz</strong> <strong>Real</strong> Estate Master FCP – SIF<br />
NOTES TO THE CONSOLIDATED FINANCIAL STATEMENTS<br />
AS AT DECEMBER 31, 2009<br />
5. Investment Properties (continued)<br />
84% of the investments held as at December 31, 2009 were located in Portugal (December 31, 2008: 85%), the remaining<br />
16% of the investments are located in Spain (December 31, 2008: 15%). The geographical split of the investments<br />
held was the following at balance sheet date:<br />
The Fund’s investment properties were revalued as at November 17, 2009 by Cushman & Wakefield LLP based on an<br />
income based approach using a 10 year discounted cash flow method. Valuations were based on current parameters in<br />
an active market for all properties. For details please refer to note 4.1.
<strong>Commerz</strong> <strong>Real</strong> Estate Master FCP – SIF<br />
NOTES TO THE CONSOLIDATED FINANCIAL STATEMENTS<br />
AS AT DECEMBER 31, 2009<br />
5. Investment Properties (continued)<br />
The carrying values of investment property at December 31, 2009 and December 31, 2008 agree to the valuations reported<br />
by the external valuers, except that in 2008 the valuation for Espacio Leon was decreased by an amount of EUR<br />
384,000 in regards to finance lease liabilities recognised in regards of a petrol station next to the shopping mall which<br />
were not taken into account in the December 2008 revaluation of the property. In the year end 2009 valuation report<br />
these financial lease liabilities have already been included.<br />
In 2009 and 2008 no borrowing costs were capitalised.<br />
The investment properties are financed by ca. 67% by loans which are completely secured by real estate mortgages.<br />
6. Trade receivables<br />
Financial Statements<br />
The estimated fair values of receivables are the discounted amount of the estimated future cash flows expected to be<br />
received and approximate their carrying amounts. Expected cash flows are discounted at current market rates to determine<br />
fair values.<br />
There is no significant concentration of credit risk with respect to trade receivables, as the Group has a large number of<br />
tenants, internationally dispersed.<br />
The individually impaired receivables are over three months past due (verified) and mainly relate to certain tenants<br />
in Espacio Leon. A provision is recognised for amounts not expected to be recovered. Movements in the accumulated<br />
impairment losses on trade receivables were as follows:<br />
91
92<br />
<strong>Commerz</strong> <strong>Real</strong> Estate Master FCP – SIF<br />
NOTES TO THE CONSOLIDATED FINANCIAL STATEMENTS<br />
AS AT DECEMBER 31, 2009<br />
7. Prepayments<br />
The prepayments are made up of prepaid rents that are related to the rents for the months January 2010 (to be verified)<br />
amounting to EUR 2,537,085 and of prepaid expenses amounting to EUR 2,550,000. The prepaid expenses are mainly<br />
related to expenses in relation to the administration of the shopping <strong>malls</strong>, insurance costs, marketing costs as well as<br />
rents paid for January 2010.<br />
8. Borrowings<br />
All the Group‘s borrowings as at December 31, 2009 are at fixed rates of interest where around 40% of the loans<br />
interest is fixed up to the end of September 2010 and up to the end of September 2017 for the remaining facilities. The<br />
Group therefore just partly exposed to fluctuations in the markets with regards to interest rates.<br />
The composition of the borrowings is as follows:<br />
The facilities expiring within one year as at the date of the statement of financial position comprise one loan which actually<br />
expires in September 2010 and is in the process of being renegotiated with the probability of extending the facility<br />
being very high. They also include the loan in Espacio León which actually only expires in 2017. This classification<br />
results from a breach of the 25% Equity covenant which is incorporated in the loan agreement between Espacio León<br />
and Eurohypo AG. (Please see Note 19 for details). Please see note 25 for details on borrowing arrangements entered<br />
into after the date of the statement of financial position.
<strong>Commerz</strong> <strong>Real</strong> Estate Master FCP – SIF<br />
NOTES TO THE CONSOLIDATED FINANCIAL STATEMENTS<br />
AS AT DECEMBER 31, 2009<br />
9. Deferred income<br />
The deferred income mainly relates to prepaid gross rental income for the first two months of 2010.<br />
10. Trade and other payables<br />
The estimated fair values of payables are the discounted amount of the estimated future cash flows expected to be paid<br />
and approximate their carrying amounts. Expected cash flows are discounted at current market rates to determine fair<br />
values.<br />
Trade payables are interest free and have settlement dates within one year.<br />
Financial Statements<br />
93
<strong>Commerz</strong> <strong>Real</strong> Estate Master FCP – SIF<br />
NOTES TO THE CONSOLIDATED FINANCIAL STATEMENTS<br />
AS AT DECEMBER 31, 2009<br />
11. Net income from investment properties<br />
12. Other direct property operating expenses<br />
13. Other expenses
<strong>Commerz</strong> <strong>Real</strong> Estate Master FCP – SIF<br />
NOTES TO THE CONSOLIDATED FINANCIAL STATEMENTS<br />
AS AT DECEMBER 31, 2009<br />
14. Property management fees<br />
Property management fees are comprised of a fixed percentage charged on key turnover factors, such as rental income,<br />
key monies, mall income, as well as cession and transfer fees. For the financial year 2009 property management fees of<br />
EUR 3,090,809 (2008: EUR 3,765,539) have been incurred by the Group.<br />
15. Finance income and costs<br />
Until the end of the reporting period 2009 the Fund incurred interest expenses of EUR 18,716,878 (2008: EUR<br />
19,475,264). In addition to that the Fund incurred EUR 818,128 of bank charges (2008: EUR 815,929). Furthermore, until<br />
December 31, 2009 EUR 959,115 (2008: EUR 1,115,347) of amortizations of three loans which were acquired in the<br />
course of the acquisitions of the Portuguese and Spanish properties were included in the interest expense capture.<br />
The movements in amortization of above mentioned loans are as follows:<br />
The finance costs of the Fund can be summarised as follows:<br />
Financial Statements<br />
At the same time EUR 104,053 of finance income was recognised in the financial year 2009 (2008: EUR 554,795) which<br />
comprises mainly of interest income on cash held on bank accounts in the different entities of the Group.<br />
95
96<br />
<strong>Commerz</strong> <strong>Real</strong> Estate Master FCP – SIF<br />
NOTES TO THE CONSOLIDATED FINANCIAL STATEMENTS<br />
AS AT DECEMBER 31, 2009<br />
16. Share capital<br />
<strong>CG</strong> <strong>malls</strong> <strong>europe</strong> initially issued Class A Units to investors (including to <strong>Commerz</strong> <strong>Real</strong> AG), a Class F Unit (Fee Unit)<br />
and a Class P Unit (Promote Unit). As at December 31, 2009 only Class A Units have been issued. Furthermore:<br />
- Each Class A Unit participates proportionally to the aggregate number of other Class A Units of the relevant Series in<br />
all distributions and in the proceeds of any winding up of <strong>CG</strong> Mall Europe that are allocable to such Series of Class A<br />
Units in accordance with the Percentage Interest from time to time of such Series of Class A Units.<br />
- A Class F Unit will be issued to the Management Company upon decision from the managers of the Fund. The Class<br />
F Unit participates in all distributions and in the proceeds of any winding up of <strong>CG</strong> <strong>malls</strong> <strong>europe</strong> that are allocable<br />
to the Class F Unit in accordance with the Percentage Interest from time to time of the Class F Unit. The Class F Unit<br />
has the same economic rights as Class A Units, except that<br />
(i) it does not pay the Deferred Management Fee or the Promote;<br />
(ii) it has preferred redemption rights;<br />
(iii) the Percentage Interest of the Class F Unit will initially be 0% and it will be increased quarterly by the value of the<br />
aggregate Deferred Management Fee for such period (see clause 6.2.4 of the Private Placement Memorandum).<br />
As at December 31, 2009 the total authorised number of Class A shares outstanding is 2.90 million with a par value of<br />
EUR 100 per unit (2008: EUR 100 per unit). All issued units are fully paid.<br />
The Board of Directors of the Management Company may decide to create shares of different classes. The classes may<br />
differ in their fee structure, minimum investment requirements, type of target investors and distribution policy.
<strong>Commerz</strong> <strong>Real</strong> Estate Master FCP – SIF<br />
NOTES TO THE CONSOLIDATED FINANCIAL STATEMENTS<br />
AS AT DECEMBER 31, 2009<br />
17. Retained earnings<br />
18. Changes in working capital<br />
The change in the Fund’s working capital is derived as follows:<br />
19. Consolidated entities<br />
Entities included in the scope of the consolidation as at December 31, 2009 are as follows:<br />
Financial Statements<br />
97
98<br />
<strong>Commerz</strong> <strong>Real</strong> Estate Master FCP – SIF<br />
NOTES TO THE CONSOLIDATED FINANCIAL STATEMENTS<br />
AS AT DECEMBER 31, 2009<br />
19. Consolidated entities (continued)<br />
During 2009, the Group breached a 25% Equity covenant which is incorporated in the loan agreement between Espacio<br />
León Propco S.L. and Eurohypo AG. Despite the covenant breach the lender did not request accelerated repayment of<br />
the loan.<br />
During two consecutive years the equity of Espacio León Propco., S.L. has fallen below 50% of the amount of its nominal<br />
share capital. Pursuant to Spanish Law, this would constitute a cause of mandatory dissolution. However, Royal<br />
Decree Law 10/2008 (the RD) established that, for the purposes of mandatory dissolution, any losses due to, amongst<br />
others, deterioration of the value of fixed assets shall not be considered, allowing for a 2-year suspension on the mandatory<br />
dissolution. This 2-year suspension would have seized on December 31, 2009 but was extended until December 31,<br />
2011 in March 2010 (please refer to Note 25 for further details). As the losses which were encountered by Espacio León<br />
since the acquisition of the investment property were mainly due to deterioration of the value of the property Royal<br />
Decree Law is applicable to Espacio León until December 31, 2011.<br />
20. Related party transactions<br />
Pursuant to the Private Placement Memorandum dated July 13, 2007 the Fund has appointed <strong>Commerz</strong> <strong>Real</strong> AG as<br />
Investment Advisor with the responsibility to prepare the purchase and sale of commercial real estate properties for the<br />
Fund and advise the Fund with respect to asset management.<br />
(a) Management Fee<br />
The Management Company is entitled to receive a Management Fee in an amount of 0.50% per annum of the Gross Asset<br />
Value of the Fund, with rebates being granted to Investors depending on the Aggregate Investment Amount of such<br />
Investor and to Investors subscribing for Units at the Initial Closing or acquiring Units before June 30, 2008 (see below).<br />
The reduced Management Fee percentage is determined by reference to a fee waterfall, with the applicable percentage<br />
decreasing as the Aggregate Investment Amount increases.<br />
Aggregate Investment Amount Applicable Management Fee percentage<br />
€0 - €50 million 0.50%<br />
€50 million or more 0.45%<br />
The applicable Management Fee percentage for Investors subscribing for Units at the Initial Closing or acquiring Units<br />
before June 30, 2008 shall be 0.45% for a period of 10 years commencing with the Initial Closing; accordingly, the<br />
Management Company will pay each such Unitholder corresponding rebates of the Management Fee in respect of Units<br />
subscribed by such Unitholder at the Initial Closing or acquired by such Unitholder before June 30, 2008.<br />
After the expiry of 10 years commencing with the Initial Closing the applicable Management Fee percentage and the<br />
entitlement to any rebate of the Management Fee for Investors subscribing for Units at the Initial Closing or acquiring<br />
Units before June 30, 2008 shall be calculated in the same manner as for all other Unitholders. As at December 31, 2009<br />
the Fund disclosed Management Fees amounting to EUR 3,077,666 (as at December 31, 2008: EUR 3,335,217).
<strong>Commerz</strong> <strong>Real</strong> Estate Master FCP – SIF<br />
NOTES TO THE CONSOLIDATED FINANCIAL STATEMENTS<br />
AS AT DECEMBER 31, 2009<br />
20. Related party transactions (continued)<br />
(b) Acquisition Fee<br />
The Fund will pay an Acquisition Fee of 1.00% of the purchase price of each <strong>Real</strong> Estate investment made. The Acquisition<br />
Fee equals 2.00% of the purchase price for each Forward Funding Project arrangement entered into. All acquisitions<br />
of the seed portfolio were bought from an entity of <strong>Commerz</strong> <strong>Real</strong> Group, a related party of the <strong>CG</strong> <strong>Real</strong> Estate<br />
Master FCP - SIF. All acquisition fees in relation to the acquisitions of the seed portfolio had been waived. Apart from<br />
the seed portfolio no further acquisitions were done in 2008 or 2009.<br />
(c) Subscription Fee<br />
Each Investor will be required to pay upon subscription a Subscription Fee in an amount of 1.00% of the Investor’s<br />
aggregate Capital Commitment, but not more than EUR 250,000. The Subscription Fees will be used by the Management<br />
Company inter alia to offset the establishment costs of the fund. Investors subscribing for Units at the Initial Closing and<br />
Group Entities of such Investors shall not be required to pay a Subscription Fee.<br />
(d) Promoter Fees<br />
<strong>Commerz</strong> Grundbesitzgesellschaft Group will bear all third party investment banking and brokerage services connected<br />
with the creation of the Fund. For the period ended December 31, 2008 all promoter fees have been fully paid by<br />
<strong>Commerz</strong> <strong>Real</strong> AG.<br />
(e) Arrangement Fees<br />
Financial Statements<br />
The Management Company will be entitled to participate in the capital growth of the Portfolio pursuant to a promote<br />
mechanism. Provided the Net Asset Value (“NAV”) growth in any year exceeds a hurdle of 4%, the Management Company<br />
will be entitled to be allocated 20% of the excess capital growth. The annual Promote allocation so made will only<br />
vest and be payable to the Management Company, however, if and to the extent the NAV has been retained or exceeded<br />
three years after the relevant year for which the promote may apply. At the end of the reporting periods 2008 and 2009<br />
no arrangement fees were due.<br />
99
100<br />
<strong>Commerz</strong> <strong>Real</strong> Estate Master FCP – SIF<br />
NOTES TO THE CONSOLIDATED FINANCIAL STATEMENTS<br />
AS AT DECEMBER 31, 2009<br />
21. Income and withholding tax expenses<br />
Movements in the Fund’s income tax expense position are as follows:<br />
The tax on the Group’s profit before taxes differs from the theoretical amount that would arise using the weighted average<br />
tax rate on the applicable profits of the consolidated companies as follows:<br />
The weighted average applicable tax rate was 33.15% in 2009 (2008: 33.20%). The decrease is solely caused by a<br />
change in the profitability of the group’s subsidiaries in the respective countries.<br />
In Portugal interest payments paid to non-residents are subject to withholding tax. As per balance sheet date, two loan<br />
facility agreements were signed between the Luxembourgian lenders <strong>CG</strong>M Lux 2 Sarl and <strong>CG</strong>M Lux 3 Sarl and Forum<br />
Almada and Forum Montijo respectively. According to the loan facility agreements these loans accrue interest on a<br />
quarterly basis and both Forum Almada and Forum Montijo have been levying withholding tax on the interest amounts<br />
paid. The payment and withholding taxes on the interest were postponed to the end of 2009 and interests were accrued<br />
in the books. These withholding taxes are due when the interest payments are arranged or when the interest payments<br />
become due. In Portugal the domestic withholding tax rate on interest due/payment to non-residents is currently 20%.<br />
Applying the Portuguese – Luxembourgian Double Tax Treaty the withholding tax rates for cross border interest payments<br />
is reduced to 5%. After elapsing the holding period of two years of Forum Almada and Forum Montijo and when<br />
other formal conditions are fulfilled, it will be
<strong>Commerz</strong> <strong>Real</strong> Estate Master FCP – SIF<br />
NOTES TO THE CONSOLIDATED FINANCIAL STATEMENTS<br />
AS AT DECEMBER 31, 2009<br />
21. Income and withholding tax expenses (continued)<br />
possible for <strong>CG</strong>M Lux 2 and <strong>CG</strong>M Lux 3 to apply for the Interest & Royalties Directive (“I&R Directive”) withholding tax<br />
rates for Portugal effecting a partial refund of the withholding tax. Under the I&R Directive in principle no withholding<br />
tax is levied. Portugal implemented a transitory regulation in connection to the withholding tax rates that approach step<br />
by step to the I&R Directive. The withholding tax rates according to that transitory regime are:<br />
(i) 10% until June 2009<br />
(ii) 5% from July 2009 until June 30, 2013<br />
(iii) Nil after 1 July 2013.<br />
Furthermore, in case certain conditions are met it will be possible for <strong>CG</strong>M Lux 2 and <strong>CG</strong>M Lux 3 after elapse of the two<br />
year holding period to apply for the refund of:<br />
(i) 5% of the interest due until June 30, 2009<br />
(ii) 10% of the interest due between July 1, 2009 and October 31, 2009<br />
In order to take advantage of this option, the Management has decided to amend both loan facility agreements to allow<br />
for a two year holding period of the interest payments of both companies.<br />
The effects of the amendment of the loan facility agreements are as follows:<br />
22. Deferred income tax<br />
Deferred income tax assets and liabilities are offset when there is a legally enforceable right to offset current tax assets<br />
against current tax liabilities and when the deferred income taxes assets and liabilities relate to income taxes levied by<br />
the same taxation authority on either the taxable entity or different taxable entities where there is an intention to settle<br />
the balances on a net basis.<br />
The gross movement in the deferred income tax account is as follows:<br />
Financial Statements<br />
The movement in deferred income liabilities during the year, without taking into consideration the offsetting of balances<br />
within the same tax jurisdiction, is as follows:<br />
101
102<br />
<strong>Commerz</strong> <strong>Real</strong> Estate Master FCP – SIF<br />
NOTES TO THE CONSOLIDATED FINANCIAL STATEMENTS<br />
AS AT DECEMBER 31, 2009<br />
22. Deferred income tax (continued)<br />
The reason of the deferred income tax position is in regards to the carrying amount and tax base of borrowings held.<br />
23. Reconciliation to trading NAV per share<br />
For the purpose of calculating the trading NAV per share used for issuance and redemptions of shares, the Fund takes<br />
into account an amount reflecting the following adjustments in accordance with the Private Placement Memorandum to<br />
the Net Asset Value calculated in the consolidated balance sheet:<br />
(i) <strong>Real</strong> estate investments are initially recorded at cost including direct acquisition costs such as property transfer<br />
taxes and professional fees which qualify for initial capitalisation under IAS 40. On subsequent revaluation to<br />
fair value such costs are expensed as part of the fair value adjustment in accordance with IAS 40. All other direct<br />
acquisition costs are expensed in the period when they are incurred. In accordance with the Management Regulations,<br />
acquisition costs are capitalized and subsequently amortized for the purpose of calculating the trading<br />
NAV per share. The amortization is straight-line over a four year period. The purchase of Espacio León triggered<br />
the payment of acquisition costs comprising of stamp duty of EUR 1,560,000.00 and other fees of EUR 43,225.00<br />
amounting to 1,603,225.00.<br />
(ii) The equity or liability interests attributable to unit holders derived from these financial statements will be adjusted to<br />
take into account the fair (i.e. discounted) value of deferred tax liabilities (calculated under IFRS on an undiscounted<br />
basis) as determined by the Management Company.
<strong>Commerz</strong> <strong>Real</strong> Estate Master FCP – SIF<br />
NOTES TO THE CONSOLIDATED FINANCIAL STATEMENTS<br />
AS AT DECEMBER 31, 2009<br />
23. Reconciliation to trading NAV per share (continued)<br />
As part of the purchases of Almada Forum and Forum Montijo, the Fund acquired four entities - Almada Cda, Al-<br />
mada Lda, Brafero S.A. and Montijo Lda. The purchase price for all four entities was generally based on the balance<br />
sheets of the entities according to Portuguese GAAP with several adjustments to reflect additional pricing compo-<br />
nents. One of the adjustments to Portuguese GAAP related to the deferred key money positions in the balance sheet<br />
of Almada Lda and Montijo Lda. So called key money is paid by a tenant at the moment the tenant enters the center<br />
or renews a leasing agreement. The amount is paid according to the leasing agreement in order to compensate the<br />
owner for all investments made for the business. According to Portuguese GAAP, the respective key money payment<br />
must be deferred in the balance of the recipient over the term of the leasing agreement. However, as it is not refunda-<br />
ble if the tenant terminates the leasing agreement prior to its expiration, the deferred income positions in the balan-<br />
ces do not have a real liability character. To reflect the issue of the deferred key monies properly, the Fund compen-<br />
sated the seller for the deferred income position relating to the deferred key money by discounting the future net of<br />
tax income to the closing date. The amounts paid as compensation to the entity’s equity were EUR 1,858,855.52 for<br />
Almada Lda and EUR 658,649.67 for Montijo Lda. These payments were then to be activated in the balance sheets of<br />
the acquiring entities as goodwill to be amortized according to the term of the underlying deferred income positions.<br />
However the Fund’s auditor decided that such an approach is not possible under IFRS, because these payments do<br />
not fulfill the requirements necessary for goodwill under IFRS. As a result, the total amount of EUR 2,517,505.19<br />
had to be written off. Such treatment of the compensation paid from the Management Company’s point of view does<br />
not lead to a fair-value trading NAV of the Fund. Furthermore, such treatment may result in dissimilar treatment of<br />
investors as future investors would pay too little for purchased units. As a result the Management Company issued<br />
Declaration of Consent letters to all of its current investors to amend the terms of the Fund in order to reflect the<br />
situation addressed above properly. All investors agreed to the adjustments proposed by the Management Company<br />
and starting from March 2008 the adjustments were implemented with immediate effect.<br />
24. Contingencies<br />
The Fund, through its direct and indirect subsidiaries, is contingently liable with respect to lawsuits and matters that<br />
arise in the normal course of business. Management is of the opinion that while it is impossible to ascertain the ultimate<br />
legal and financial liability with respect to these contingencies, the ultimate outcome of these contingencies is not anti-<br />
cipated to have a material effect on the Fund’s financial position and operations.<br />
Financial Statements<br />
103
104<br />
<strong>Commerz</strong> <strong>Real</strong> Estate Master FCP – SIF<br />
NOTES TO THE CONSOLIDATED FINANCIAL STATEMENTS<br />
AS AT DECEMBER 31, 2009<br />
25. Events after the balance sheet date<br />
As described in Note 19 Espacio León breached one of the covenants agreed upon in the loan agreement with Eurohypo<br />
AG. In order to remediate this covenant breach the existing shareholder loan (SHL) between <strong>CG</strong>M Lux 3 S.à r.l. and<br />
Espacio León Propco S.L. has been converted into a profit participation loan (PPL) and the amount of the loan has been<br />
increased by € 4 Mio which ensures that the required equity ratio of 25% is restored. Management has informed the<br />
lender about this conversion and has obtained written approval as at April 9, 2010 for the actions taken and confirmation<br />
that the covenant breach is regarded as solved.<br />
The conversion of the SHL into a PPL, which classifies as equity according to Spanish law, was initiated in light of<br />
the fact that the coverage of Royal Decree Law 10/2008 was meant to expire on December 31, 2010 and the restorage<br />
of 50% equity would have been mandatory. As mentioned in Note 19 by virtue of the Decree Law 5/2010 of March<br />
31, 2010 (published on April 1, 2010) the stipulations of Sole Additional Provision of Royal Decree 10/2008 are also<br />
applicable to fiscal years 2010 and 2011. However Management has decided to still perform the conversion in order to<br />
stabilize the overall economic situation of Espacio León. The SHL has been converted into a PPL based on an amendment<br />
agreement dated April 7, 2010.
<strong>CG</strong> <strong>Real</strong> Estate Luxembourg S.à r.l.<br />
25, rue Edward Steichen<br />
L-2540 Luxembourg<br />
Phone: +352 47 79 11 25 02<br />
Fax: +352 47 79 11 25 99