Computational tools and Interoperability in Comparative ... - CBS
Computational tools and Interoperability in Comparative ... - CBS
Computational tools and Interoperability in Comparative ... - CBS

Create successful ePaper yourself
Turn your PDF publications into a flip-book with our unique Google optimized e-Paper software.
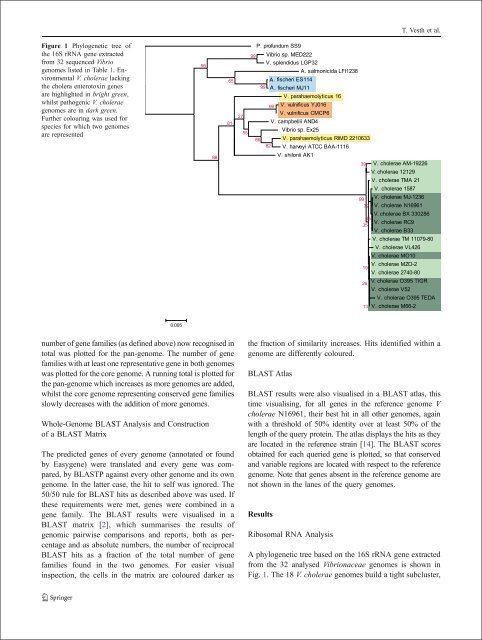
Figure 1 Phylogenetic tree of<br />
the 16S rRNA gene extracted<br />
from 32 sequenced Vibrio<br />
genomes listed <strong>in</strong> Table 1. Environmental<br />
V. cholerae lack<strong>in</strong>g<br />
the cholera enterotox<strong>in</strong> genes<br />
are highlighted <strong>in</strong> bright green,<br />
whilst pathogenic V. cholerae<br />
genomes are <strong>in</strong> dark green.<br />
Further colour<strong>in</strong>g was used for<br />
species for which two genomes<br />
are represented<br />
number of gene families (as def<strong>in</strong>ed above) now recognised <strong>in</strong><br />
total was plotted for the pan-genome. The number of gene<br />
families with at least one representative gene <strong>in</strong> both genomes<br />
was plotted for the core genome. A runn<strong>in</strong>g total is plotted for<br />
the pan-genome which <strong>in</strong>creases as more genomes are added,<br />
whilst the core genome represent<strong>in</strong>g conserved gene families<br />
slowly decreases with the addition of more genomes.<br />
Whole-Genome BLAST Analysis <strong>and</strong> Construction<br />
of a BLAST Matrix<br />
The predicted genes of every genome (annotated or found<br />
by Easygene) were translated <strong>and</strong> every gene was compared,<br />
by BLASTP aga<strong>in</strong>st every other genome <strong>and</strong> its own<br />
genome. In the latter case, the hit to self was ignored. The<br />
50/50 rule for BLAST hits as described above was used. If<br />
these requirements were met, genes were comb<strong>in</strong>ed <strong>in</strong> a<br />
gene family. The BLAST results were visualised <strong>in</strong> a<br />
BLAST matrix [2], which summarises the results of<br />
genomic pairwise comparisons <strong>and</strong> reports, both as percentage<br />
<strong>and</strong> as absolute numbers, the number of reciprocal<br />
BLAST hits as a fraction of the total number of gene<br />
families found <strong>in</strong> the two genomes. For easier visual<br />
<strong>in</strong>spection, the cells <strong>in</strong> the matrix are coloured darker as<br />
56<br />
88<br />
65<br />
55<br />
86<br />
the fraction of similarity <strong>in</strong>creases. Hits identified with<strong>in</strong> a<br />
genome are differently coloured.<br />
BLAST Atlas<br />
BLAST results were also visualised <strong>in</strong> a BLAST atlas, this<br />
time visualis<strong>in</strong>g, for all genes <strong>in</strong> the reference genome V<br />
cholerae N16961, their best hit <strong>in</strong> all other genomes, aga<strong>in</strong><br />
with a threshold of 50% identity over at least 50% of the<br />
length of the query prote<strong>in</strong>. The atlas displays the hits as they<br />
are located <strong>in</strong> the reference stra<strong>in</strong> [14]. The BLAST scores<br />
obta<strong>in</strong>ed for each queried gene is plotted, so that conserved<br />
<strong>and</strong> variable regions are located with respect to the reference<br />
genome. Note that genes absent <strong>in</strong> the reference genome are<br />
not shown <strong>in</strong> the lanes of the query genomes.<br />
Results<br />
Vibrio sp. MED222<br />
A<br />
A<br />
Vibrio sp. Ex25<br />
Ribosomal RNA Analysis<br />
A phylogenetic tree based on the 16S rRNA gene extracted<br />
from the 32 analysed Vibrionaceae genomes is shown <strong>in</strong><br />
Fig. 1. The 18 V. cholerae genomes build a tight subcluster,<br />
45<br />
T. Vesth et al.