Computational tools and Interoperability in Comparative ... - CBS
Computational tools and Interoperability in Comparative ... - CBS
Computational tools and Interoperability in Comparative ... - CBS

You also want an ePaper? Increase the reach of your titles
YUMPU automatically turns print PDFs into web optimized ePapers that Google loves.
<strong>Comparative</strong> Genomics<br />
1 mysql -N -B -D genomeatlas3_cur -e " select p.grp , concat (’#’, color )<br />
,ord , sum ( length ),concat ( organism_name ,’/’, segment_name ,’/’,<br />
genbank ) from atlasdb as a, genbank_complete_prj as p ,<br />
genbank_complete_seq as s , phyla as ph where s. genbank = a.<br />
accession <strong>and</strong> s. pid = p. pid <strong>and</strong> segment_name not like ’genome %’<br />
<strong>and</strong> ph. phyla = p. grp group by s. pid " > length . tbl<br />
2 set N = ‘wc -l < length .tbl ‘<br />
3 ~ pfh / scripts / boxplot -ma<strong>in</strong> " Size distribution of Prokaryotic<br />
genomes (N = $N)" < length . tbl > length .ps<br />
4 mysql -N -B -D genomeatlas3_cur -e " select p.grp , concat (’#’, color )<br />
,ord , sum ( atcontent * length )/ sum ( length ),concat ( organism_name<br />
,’/’, segment_name ,’/’, genbank ) from atlasdb as a,<br />
genbank_complete_prj as p , genbank_complete_seq as s , phyla<br />
as ph where s. genbank = a. accession <strong>and</strong> s. pid = p. pid <strong>and</strong><br />
segment_name not like ’genome %’ <strong>and</strong> ph. phyla = p. grp group by s<br />
. pid "> atcontent . tbl<br />
5 ~ pfh / scripts / boxplot -ma<strong>in</strong> "AT content distribution of Prokaryotic<br />
genomes (N = $N)" < atcontent . tbl > atcontent .ps<br />
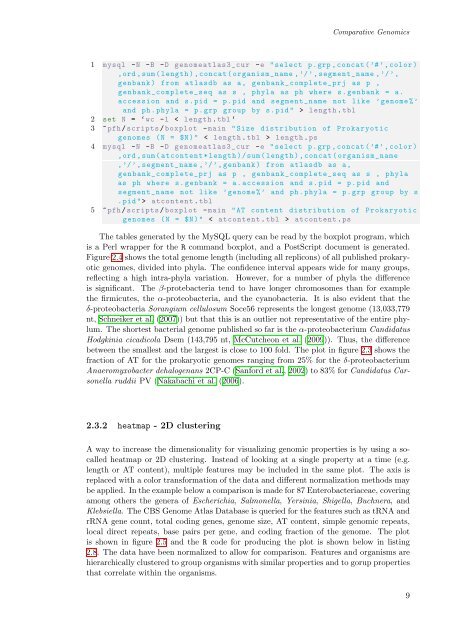
The tables generated by the MySQL query can be read by the boxplot program, which<br />
is a Perl wrapper for the R comm<strong>and</strong> boxplot, <strong>and</strong> a PostScript document is generated.<br />
Figure 2.4 shows the total genome length (<strong>in</strong>clud<strong>in</strong>g all replicons) of all published prokaryotic<br />
genomes, divided <strong>in</strong>to phyla. The confidence <strong>in</strong>terval appears wide for many groups,<br />
reflect<strong>in</strong>g a high <strong>in</strong>tra-phyla variation. However, for a number of phyla the difference<br />
is significant. The β-protebacteria tend to have longer chromosomes than for example<br />
the firmicutes, the α-proteobacteria, <strong>and</strong> the cyanobacteria. It is also evident that the<br />
δ-proteobacteria Sorangium cellulosum Soce56 represents the longest genome (13,033,779<br />
nt, Schneiker et al. (2007)) but that this is an outlier not representative of the entire phylum.<br />
The shortest bacterial genome published so far is the α-proteobacterium C<strong>and</strong>idatus<br />
Hodgk<strong>in</strong>ia cicadicola Dsem (143,795 nt, McCutcheon et al. (2009)). Thus, the difference<br />
between the smallest <strong>and</strong> the largest is close to 100 fold. The plot <strong>in</strong> figure 2.3 shows the<br />
fraction of AT for the prokaryotic genomes rang<strong>in</strong>g from 25% for the δ-proteobacterium<br />
Anaeromyxobacter dehalogenans 2CP-C (Sanford et al., 2002) to 83% for C<strong>and</strong>idatus Carsonella<br />
ruddii PV (Nakabachi et al. (2006).<br />
2.3.2 heatmap - 2D cluster<strong>in</strong>g<br />
A way to <strong>in</strong>crease the dimensionality for visualiz<strong>in</strong>g genomic properties is by us<strong>in</strong>g a socalled<br />
heatmap or 2D cluster<strong>in</strong>g. Instead of look<strong>in</strong>g at a s<strong>in</strong>gle property at a time (e.g.<br />
length or AT content), multiple features may be <strong>in</strong>cluded <strong>in</strong> the same plot. The axis is<br />
replaced with a color transformation of the data <strong>and</strong> different normalization methods may<br />
be applied. In the example below a comparison is made for 87 Enterobacteriaceae, cover<strong>in</strong>g<br />
among others the genera of Escherichia, Salmonella, Yers<strong>in</strong>ia, Shigella, Buchnera, <strong>and</strong><br />
Klebsiella. The <strong>CBS</strong> Genome Atlas Database is queried for the features such as tRNA <strong>and</strong><br />
rRNA gene count, total cod<strong>in</strong>g genes, genome size, AT content, simple genomic repeats,<br />
local direct repeats, base pairs per gene, <strong>and</strong> cod<strong>in</strong>g fraction of the genome. The plot<br />
is shown <strong>in</strong> figure 2.5 <strong>and</strong> the R code for produc<strong>in</strong>g the plot is shown below <strong>in</strong> list<strong>in</strong>g<br />
2.8. The data have been normalized to allow for comparison. Features <strong>and</strong> organisms are<br />
hierarchically clustered to group organisms with similar properties <strong>and</strong> to gorup properties<br />
that correlate with<strong>in</strong> the organisms.<br />
9