Computational tools and Interoperability in Comparative ... - CBS
Computational tools and Interoperability in Comparative ... - CBS
Computational tools and Interoperability in Comparative ... - CBS

You also want an ePaper? Increase the reach of your titles
YUMPU automatically turns print PDFs into web optimized ePapers that Google loves.
each of the reference sequences is<br />
obta<strong>in</strong>ed <strong>and</strong> <strong>in</strong>cluded <strong>in</strong> the map.<br />
The reference genome of a given<br />
comparison has a fixed size, whereas<br />
the sequences to be compared can be<br />
thought of as simply a ‘‘pile of prote<strong>in</strong>s’’,<br />
rang<strong>in</strong>g between the size from that of a<br />
small phage, to a s<strong>in</strong>gle genome, or an<br />
entire metagenomic sample or even exist<strong>in</strong>g<br />
large BLAST databases, such as<br />
UniProt. It is important to emphasize<br />
that each prote<strong>in</strong> <strong>in</strong> the reference genome<br />
is compared to all the prote<strong>in</strong>s <strong>in</strong> the<br />
query set—regardless of orientation or<br />
location. The BLASTatlas method uses<br />
the software BLASTALL v. 2.2.11 for<br />
the search, <strong>and</strong> <strong>in</strong> BLAST term<strong>in</strong>ology,<br />
the reference genome constitutes the<br />
‘query’ whereas each other genome<br />
(e.g., a lane or circle <strong>in</strong> the atlas) <strong>in</strong> the<br />
comparison corresponds to the ‘database’.<br />
We def<strong>in</strong>e a lane as a visual representation<br />
of mapped database hits<br />
(<strong>in</strong>dividual residue matches) on to the<br />
reference genome. A lane can have a<br />
boxfilter (smooth<strong>in</strong>g) applied with<strong>in</strong><br />
each of the smallest visible units of the<br />
atlas (the resolution of the graphical<br />
representation). A s<strong>in</strong>gle BLASTatlas<br />
may conta<strong>in</strong> several lanes; currently<br />
around 60 circles is the upper limit.<br />
The <strong>in</strong>put requires a file conta<strong>in</strong><strong>in</strong>g the<br />
genome sequence, <strong>in</strong>clud<strong>in</strong>g all annotated<br />
cod<strong>in</strong>g sequences (compris<strong>in</strong>g prote<strong>in</strong>-start,<br />
-stop <strong>and</strong> -direction) for the<br />
reference genome. The four programs<br />
‘BLASTp’, ‘BLASTn’, ‘BLASTx’, <strong>and</strong><br />
‘tBLASTn’ can be used for each lane of<br />
the BLASTatlas, although of course the<br />
appropriate sequences (DNA or prote<strong>in</strong>)<br />
must be provided. For example, when<br />
us<strong>in</strong>g ‘ BLASTn’ or ‘tBLASTn’ <strong>in</strong> a lane,<br />
the required DNA sequence can be a set<br />
of open read<strong>in</strong>g frames (ORFs), chromosomal<br />
contigs, entire genome sequences<br />
or even environmental (metagenomic)<br />
samples. In a pairwise fashion, the sequence<br />
of the reference is BLASTed<br />
aga<strong>in</strong>st each database def<strong>in</strong>ed by the<br />
user, employ<strong>in</strong>g the specified BLAST<br />
algorithm.<br />
Interpretation of BLAST alignments<br />
For each of the sequences def<strong>in</strong>ed <strong>in</strong> the<br />
reference, only the best hit <strong>in</strong> each database<br />
is stored. For these hits, the alignments<br />
are mapped on to the reference<br />
genome. When align<strong>in</strong>g two DNA<br />
sequences, the map shows one of four<br />
possible states for each position: match,<br />
mismatch, gap <strong>in</strong> query (reference genome),<br />
<strong>and</strong> gap <strong>in</strong> database (lane). Only<br />
the match contributes to the overall score<br />
with a value of 1, whereas mismatches<br />
<strong>and</strong> gaps <strong>in</strong> the database get a score<br />
value of zero. When align<strong>in</strong>g two prote<strong>in</strong><br />
sequences, an additional state is <strong>in</strong>troduced<br />
for conservative mismatches, <strong>in</strong>dicat<strong>in</strong>g<br />
that two am<strong>in</strong>o acids have similar<br />
physical–chemical properties; such a<br />
state will receive a score of 0.5. Match<br />
<strong>and</strong> gap states of prote<strong>in</strong> alignments are<br />
def<strong>in</strong>ed similar to those of the DNA<br />
alignments. The occurrence of gaps <strong>in</strong><br />
the reference sequence do not get a correspond<strong>in</strong>g<br />
coord<strong>in</strong>ate <strong>and</strong> are therefore<br />
ignored (see Fig. 1). In the BLASTatlas<br />
context, a map is an array of match<br />
scores. The array has the same length<br />
as the reference genome, with each position<br />
along the gene hav<strong>in</strong>g a value of 0,<br />
0.5 or 1: It should be noted that <strong>in</strong>tergenic<br />
regions (<strong>and</strong> ncRNAs, <strong>in</strong>clud<strong>in</strong>g<br />
tRNAs <strong>and</strong> rRNAs) have values of 0,<br />
because BLASTatlases only compare<br />
prote<strong>in</strong> encod<strong>in</strong>g genes. We use this as<br />
a control, check<strong>in</strong>g to make sure that the<br />
rRNA operons are visualized as ‘‘gaps’’<br />
throughout all the lanes, for example.<br />
For each database def<strong>in</strong>ed, there will be<br />
a correspond<strong>in</strong>g BLAST map with<strong>in</strong> the<br />
atlas (see Fig. 2). Each database entry of<br />
the BLAST searches must conta<strong>in</strong> a<br />
legend text for the lane, a colour code<br />
range <strong>and</strong> a scal<strong>in</strong>g method. For the<br />
colours, an upper <strong>and</strong> lower colour is<br />
required, whereas the middle colour<br />
is usually grey; all colours are def<strong>in</strong>ed<br />
<strong>in</strong> RGB <strong>in</strong>tegers rang<strong>in</strong>g from 0 to 10.<br />
The scale can be either fixed, such as<br />
rang<strong>in</strong>g from 0 to 1, or scaled us<strong>in</strong>g any<br />
number of st<strong>and</strong>ard deviations around<br />
the average.<br />
DNA properties<br />
The BLASTatlas method allows users to<br />
add structural as well as base composition<br />
<strong>in</strong>formation to the atlas by us<strong>in</strong>g the<br />
‘DNAparameters’ element <strong>in</strong> the request.<br />
These properties can be for example<br />
DNA structural properties, 7<br />
such as<br />
<strong>in</strong>tr<strong>in</strong>sic curvature, 8 global or local<br />
repeats 9 or other measures of base composition.<br />
10 A list of possible different<br />
properties currently pre-computed can<br />
be obta<strong>in</strong>ed via the onl<strong>in</strong>e documentation<br />
<strong>and</strong> type declarations of the web<br />
services description. The DNA property<br />
lanes are usually added near the center<br />
(or at the lowest part when seen from the<br />
outermost circle) of the atlas.<br />
Custom properties<br />
In addition to the st<strong>and</strong>ard DNA properties<br />
<strong>and</strong> BLAST maps, the web service<br />
provides a method for add<strong>in</strong>g <strong>in</strong>dividual<br />
customer data for example gene expression<br />
values to the atlas, us<strong>in</strong>g the ‘customMap’<br />
element <strong>in</strong> the request. Data<br />
must be provided <strong>in</strong> the form of comma<br />
separated str<strong>in</strong>gs, with each position <strong>in</strong><br />
the list correspond<strong>in</strong>g to the genomic<br />
position. When def<strong>in</strong><strong>in</strong>g custom data<br />
lanes, the colour ranges, scal<strong>in</strong>g method,<br />
<strong>and</strong> legend text must be provided.<br />
Visualization<br />
Details such as the atlas title <strong>and</strong> the<br />
geometry (l<strong>in</strong>ear or circle representation)<br />
are necessary for the f<strong>in</strong>al visualization.<br />
Once the BLAST searches are carried<br />
out <strong>and</strong> remapped to the reference<br />
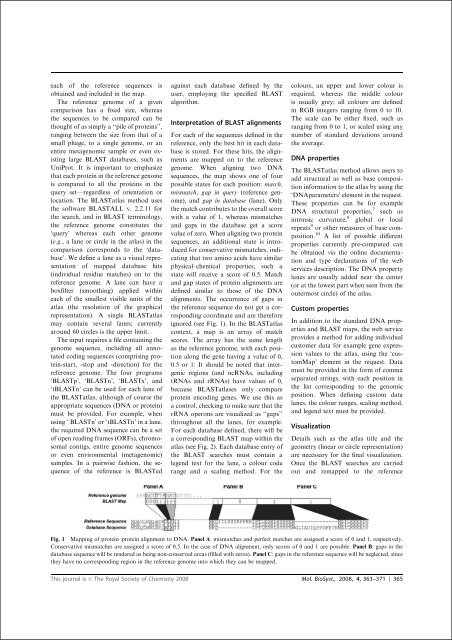
Fig. 1 Mapp<strong>in</strong>g of prote<strong>in</strong>–prote<strong>in</strong> alignment to DNA. Panel A: mismatches <strong>and</strong> perfect matches are assigned a score of 0 <strong>and</strong> 1, respectively.<br />
Conservative mismatches are assigned a score of 0.5. In the case of DNA alignment, only scores of 0 <strong>and</strong> 1 are possible. Panel B: gaps <strong>in</strong> the<br />
database sequence will be rendered as be<strong>in</strong>g non-conserved areas (filled with zeros). Panel C: gaps <strong>in</strong> the reference sequence will be neglected, s<strong>in</strong>ce<br />
they have no correspond<strong>in</strong>g region <strong>in</strong> the reference genome <strong>in</strong>to which they can be mapped.<br />
This journal is c The Royal Society of Chemistry 2008 Mol. BioSyst., 2008, 4, 363–371 | 365