Computational tools and Interoperability in Comparative ... - CBS
Computational tools and Interoperability in Comparative ... - CBS
Computational tools and Interoperability in Comparative ... - CBS

You also want an ePaper? Increase the reach of your titles
YUMPU automatically turns print PDFs into web optimized ePapers that Google loves.
Conservation of regulatory elements<br />
Ri<br />
Ri<br />
−15 −10 −5 0 5 10<br />
−10 −5 0 5 10 15<br />
P1: Raw comb<strong>in</strong>ed scores, −10,−35, UP (E.coli) (N=63)<br />
−500 −400 −300 −200 −100 0<br />
Position relative to 16S gene start<br />
(a)<br />
P2: Raw comb<strong>in</strong>ed scores, −10,−35, UP (E. coli) (N=63)<br />
−500 −400 −300 −200 −100 0<br />
Position relative to 16S gene start<br />
(c)<br />
Ri<br />
Ri<br />
−15 −10 −5 0 5 10 15<br />
−10 −5 0 5 10 15<br />
P1: Adjusted comb<strong>in</strong>ed scores, −10,−35, UP (E.coli) (N=63)<br />
−500 −400 −300 −200 −100 0<br />
Position relative to gene start<br />
(b)<br />
P2: Adjusted comb<strong>in</strong>ed scores, −10,−35, UP (E. coli) (N=63)<br />
−500 −400 −300 −200 −100 0<br />
Position relative to gene start<br />
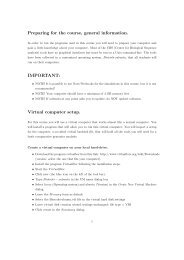
Figure 3.6: Profiles show<strong>in</strong>g the maximum Ri(tot) scores of the <strong>in</strong>itial weight matrices applied to<br />
E. coli <strong>and</strong> Shigella: Unadjusted P1 scores (a), Adjusted P1 scores (b), Unadjusted P2 scores (c),<br />
<strong>and</strong> Adjusted P2 scores (d)<br />
3.3.2 Iterat<strong>in</strong>g weight matrix frequencies<br />
The program iscan was developed to query a given DNA sequence <strong>and</strong> for every position <strong>in</strong><br />
this sequence calculate the maximum Ri(tot) that can be obta<strong>in</strong>ed by try<strong>in</strong>g out different<br />
spac<strong>in</strong>g configuraitons with<strong>in</strong> a specified w<strong>in</strong>dow. The iscan algorithm aligns the first<br />
matrix with the query (<strong>in</strong> this case the –10 hexamer) <strong>and</strong> tries all distances between 13<br />
<strong>and</strong> 19 nucleotides towards the –35 hexamer, us<strong>in</strong>g 16 nucleotides as the center. Then<br />
the program locks the optimal of those distances, <strong>and</strong> cont<strong>in</strong>ues with the next box (<strong>in</strong><br />
this case the the UP element) until all elements have been <strong>in</strong>cluded. For source code, see<br />
appendix D.5. The spac<strong>in</strong>g configuration of the two models is shown <strong>in</strong> figure ??.<br />
The maximum Ri(tot) values of all operons were stacked <strong>and</strong> average <strong>and</strong> st<strong>and</strong>ard<br />
deviation values were plotted as function of position. Because the distance between P1/P2<br />
<strong>and</strong> the 16S gene varies slightly, the unadjusted plots appear noisy. By shift<strong>in</strong>g the plots<br />
slightly by align<strong>in</strong>g to local maxima around P1 <strong>and</strong> P2 renders the P1 <strong>and</strong> P2 model scores<br />
sharper (see figure 3.6).<br />
3.3.3 Ref<strong>in</strong><strong>in</strong>g E. coli <strong>and</strong> Shigella models<br />
All peaks of Ri(tot) around the regions of P1 <strong>and</strong> P2 have been collected, <strong>and</strong> the P1 <strong>and</strong><br />
P2 models were ref<strong>in</strong>ed by adjust<strong>in</strong>g matrix parameters accord<strong>in</strong>g to the observed base<br />
frequencies <strong>in</strong> the hits obta<strong>in</strong>ed. The logo plots of are shown <strong>in</strong> figure 3.7<br />
112<br />
(d)