Computational tools and Interoperability in Comparative ... - CBS
Computational tools and Interoperability in Comparative ... - CBS
Computational tools and Interoperability in Comparative ... - CBS

You also want an ePaper? Increase the reach of your titles
YUMPU automatically turns print PDFs into web optimized ePapers that Google loves.
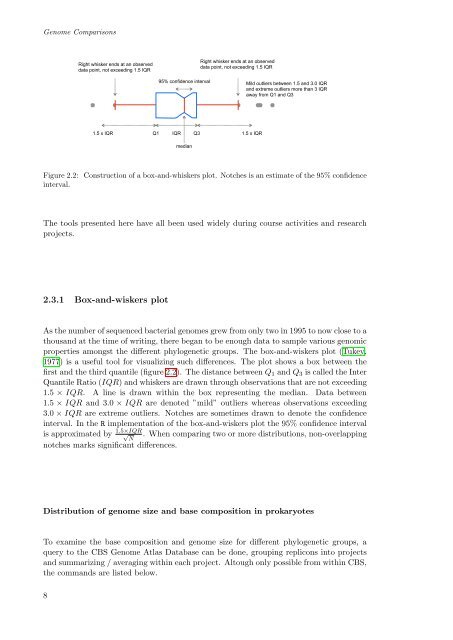
Genome Comparisons<br />
Right whisker ends at an observed<br />
data po<strong>in</strong>t, not exceed<strong>in</strong>g 1.5 IQR<br />
1.5 x IQR<br />
95% confidence <strong>in</strong>terval<br />
Q1 IQR Q3<br />
1.5 x IQR<br />
median<br />
Right whisker ends at an observed<br />
data po<strong>in</strong>t, not exceed<strong>in</strong>g 1.5 IQR<br />
Mild outliers between 1.5 <strong>and</strong> 3.0 IQR<br />
<strong>and</strong> extreme outliers more than 3 IQR<br />
away from Q1 <strong>and</strong> Q3<br />
Figure 2.2: Construction of a box-<strong>and</strong>-whiskers plot. Notches is an estimate of the 95% confidence<br />
<strong>in</strong>terval.<br />
The <strong>tools</strong> presented here have all been used widely dur<strong>in</strong>g course activities <strong>and</strong> research<br />
projects.<br />
2.3.1 Box-<strong>and</strong>-wiskers plot<br />
As the number of sequenced bacterial genomes grew from only two <strong>in</strong> 1995 to now close to a<br />
thous<strong>and</strong> at the time of writ<strong>in</strong>g, there began to be enough data to sample various genomic<br />
properties amongst the different phylogenetic groups. The box-<strong>and</strong>-wiskers plot (Tukey,<br />
1977) is a useful tool for visualiz<strong>in</strong>g such differences. The plot shows a box between the<br />
first <strong>and</strong> the third quantile (figure 2.2). The distance between Q1 <strong>and</strong> Q3 is called the Inter<br />
Quantile Ratio (IQR) <strong>and</strong> whiskers are drawn through observations that are not exceed<strong>in</strong>g<br />
1.5 × IQR. A l<strong>in</strong>e is drawn with<strong>in</strong> the box represent<strong>in</strong>g the median. Data between<br />
1.5 × IQR <strong>and</strong> 3.0 × IQR are denoted ”mild” outliers whereas observations exceed<strong>in</strong>g<br />
3.0 × IQR are extreme outliers. Notches are sometimes drawn to denote the confidence<br />
<strong>in</strong>terval. In the R implementation of the box-<strong>and</strong>-wiskers plot the 95% confidence <strong>in</strong>terval<br />
is approximated by 1.5×IQR<br />
√ . When compar<strong>in</strong>g two or more distributions, non-overlapp<strong>in</strong>g<br />
N<br />
notches marks significant differences.<br />
Distribution of genome size <strong>and</strong> base composition <strong>in</strong> prokaryotes<br />
To exam<strong>in</strong>e the base composition <strong>and</strong> genome size for different phylogenetic groups, a<br />
query to the <strong>CBS</strong> Genome Atlas Database can be done, group<strong>in</strong>g replicons <strong>in</strong>to projects<br />
<strong>and</strong> summariz<strong>in</strong>g / averag<strong>in</strong>g with<strong>in</strong> each project. Altough only possible from with<strong>in</strong> <strong>CBS</strong>,<br />
the comm<strong>and</strong>s are listed below.<br />
8