

Understanding Consumer Reactions to Assortment Unavailability
Understanding Consumer Reactions to Assortment Unavailability
Understanding Consumer Reactions to Assortment Unavailability

Create successful ePaper yourself
Turn your PDF publications into a flip-book with our unique Google optimized e-Paper software.
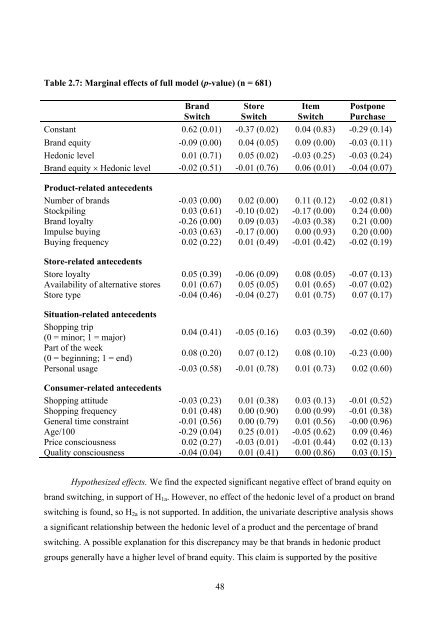
Table 2.7: Marginal effects of full model (p-value) (n = 681)<br />
Brand<br />
Switch<br />
48<br />
S<strong>to</strong>re<br />
Switch<br />
Item<br />
Switch<br />
Postpone<br />
Purchase<br />
Constant 0.62 (0.01) -0.37 (0.02) 0.04 (0.83) -0.29 (0.14)<br />
Brand equity -0.09 (0.00) 0.04 (0.05) 0.09 (0.00) -0.03 (0.11)<br />
Hedonic level 0.01 (0.71) 0.05 (0.02) -0.03 (0.25) -0.03 (0.24)<br />
Brand equity × Hedonic level -0.02 (0.51) -0.01 (0.76) 0.06 (0.01) -0.04 (0.07)<br />
Product-related antecedents<br />
Number of brands -0.03 (0.00) 0.02 (0.00) 0.11 (0.12) -0.02 (0.81)<br />
S<strong>to</strong>ckpiling 0.03 (0.61) -0.10 (0.02) -0.17 (0.00) 0.24 (0.00)<br />
Brand loyalty -0.26 (0.00) 0.09 (0.03) -0.03 (0.38) 0.21 (0.00)<br />
Impulse buying -0.03 (0.63) -0.17 (0.00) 0.00 (0.93) 0.20 (0.00)<br />
Buying frequency 0.02 (0.22) 0.01 (0.49) -0.01 (0.42) -0.02 (0.19)<br />
S<strong>to</strong>re-related antecedents<br />
S<strong>to</strong>re loyalty 0.05 (0.39) -0.06 (0.09) 0.08 (0.05) -0.07 (0.13)<br />
Availability of alternative s<strong>to</strong>res 0.01 (0.67) 0.05 (0.05) 0.01 (0.65) -0.07 (0.02)<br />
S<strong>to</strong>re type -0.04 (0.46) -0.04 (0.27) 0.01 (0.75) 0.07 (0.17)<br />
Situation-related antecedents<br />
Shopping trip<br />
(0 = minor; 1 = major)<br />
0.04 (0.41) -0.05 (0.16) 0.03 (0.39) -0.02 (0.60)<br />
Part of the week<br />
(0 = beginning; 1 = end)<br />
0.08 (0.20) 0.07 (0.12) 0.08 (0.10) -0.23 (0.00)<br />
Personal usage -0.03 (0.58) -0.01 (0.78) 0.01 (0.73) 0.02 (0.60)<br />
<strong>Consumer</strong>-related antecedents<br />
Shopping attitude -0.03 (0.23) 0.01 (0.38) 0.03 (0.13) -0.01 (0.52)<br />
Shopping frequency 0.01 (0.48) 0.00 (0.90) 0.00 (0.99) -0.01 (0.38)<br />
General time constraint -0.01 (0.56) 0.00 (0.79) 0.01 (0.56) -0.00 (0.96)<br />
Age/100 -0.29 (0.04) 0.25 (0.01) -0.05 (0.62) 0.09 (0.46)<br />
Price consciousness 0.02 (0.27) -0.03 (0.01) -0.01 (0.44) 0.02 (0.13)<br />
Quality consciousness -0.04 (0.04) 0.01 (0.41) 0.00 (0.86) 0.03 (0.15)<br />
Hypothesized effects. We find the expected significant negative effect of brand equity on<br />
brand switching, in support of H1a. However, no effect of the hedonic level of a product on brand<br />
switching is found, so H2a is not supported. In addition, the univariate descriptive analysis shows<br />
a significant relationship between the hedonic level of a product and the percentage of brand<br />
switching. A possible explanation for this discrepancy may be that brands in hedonic product<br />
groups generally have a higher level of brand equity. This claim is supported by the positive


