Northern Alliance - BFI
Northern Alliance - BFI
Northern Alliance - BFI

Create successful ePaper yourself
Turn your PDF publications into a flip-book with our unique Google optimized e-Paper software.
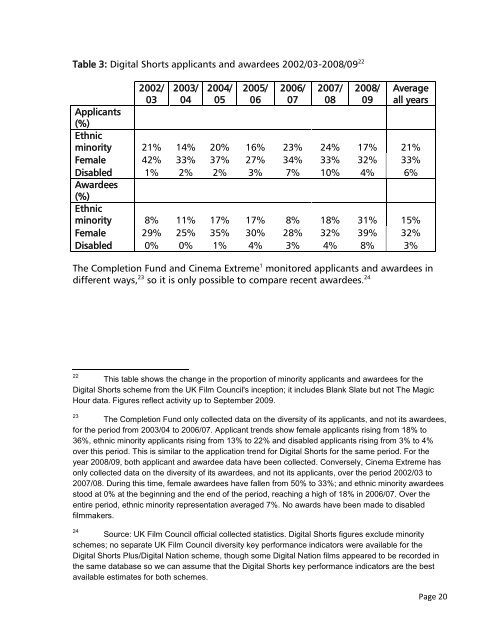
Table 3: Digital Shorts applicants and awardees 2002/03-2008/09 22<br />
2002/<br />
03<br />
2003/<br />
04<br />
2004/<br />
05<br />
2005/<br />
06<br />
2006/<br />
07<br />
2007/<br />
08<br />
2008/<br />
09<br />
Average<br />
all years<br />
Applicants<br />
(%)<br />
Ethnic<br />
minority 21% 14% 20% 16% 23% 24% 17% 21%<br />
Female 42% 33% 37% 27% 34% 33% 32% 33%<br />
Disabled 1% 2% 2% 3% 7% 10% 4% 6%<br />
Awardees<br />
(%)<br />
Ethnic<br />
minority 8% 11% 17% 17% 8% 18% 31% 15%<br />
Female 29% 25% 35% 30% 28% 32% 39% 32%<br />
Disabled 0% 0% 1% 4% 3% 4% 8% 3%<br />
The Completion Fund and Cinema Extreme 1 monitored applicants and awardees in<br />
different ways, 23 so it is only possible to compare recent awardees. 24<br />
22 This table shows the change in the proportion of minority applicants and awardees for the<br />
Digital Shorts scheme from the UK Film Council's inception; it includes Blank Slate but not The Magic<br />
Hour data. Figures reflect activity up to September 2009.<br />
23 The Completion Fund only collected data on the diversity of its applicants, and not its awardees,<br />
for the period from 2003/04 to 2006/07. Applicant trends show female applicants rising from 18% to<br />
36%, ethnic minority applicants rising from 13% to 22% and disabled applicants rising from 3% to 4%<br />
over this period. This is similar to the application trend for Digital Shorts for the same period. For the<br />
year 2008/09, both applicant and awardee data have been collected. Conversely, Cinema Extreme has<br />
only collected data on the diversity of its awardees, and not its applicants, over the period 2002/03 to<br />
2007/08. During this time, female awardees have fallen from 50% to 33%; and ethnic minority awardees<br />
stood at 0% at the beginning and the end of the period, reaching a high of 18% in 2006/07. Over the<br />
entire period, ethnic minority representation averaged 7%. No awards have been made to disabled<br />
filmmakers.<br />
24 Source: UK Film Council official collected statistics. Digital Shorts figures exclude minority<br />
schemes; no separate UK Film Council diversity key performance indicators were available for the<br />
Digital Shorts Plus/Digital Nation scheme, though some Digital Nation films appeared to be recorded in<br />
the same database so we can assume that the Digital Shorts key performance indicators are the best<br />
available estimates for both schemes.<br />
Page 20