- Page 1 and 2: Code Manual for CONTAIN 2.0: A Comp
- Page 3: ABSTRACT The CONTAIN 2.0 computer c
- Page 6 and 7: TABLE OF CONTENTS (CONTINUED) 4.0 A
- Page 8 and 9: R O TABLE OF CONTENTS (CONTINUED) 6
- Page 10 and 11: TABLE OF CONTENTS (CONTINUED) 9.1.3
- Page 12 and 13: TABLE OF CONTENTS (CO NTINUED) 13.0
- Page 14 and 15: TABLE OF CONTENTS (CONTINUED) 14.2.
- Page 16 and 17: TABLE OF CONTENTS (CONTINUED) 16.3.
- Page 18 and 19: TABLE OF CONTENTS (CONCLUDED) C.2Va
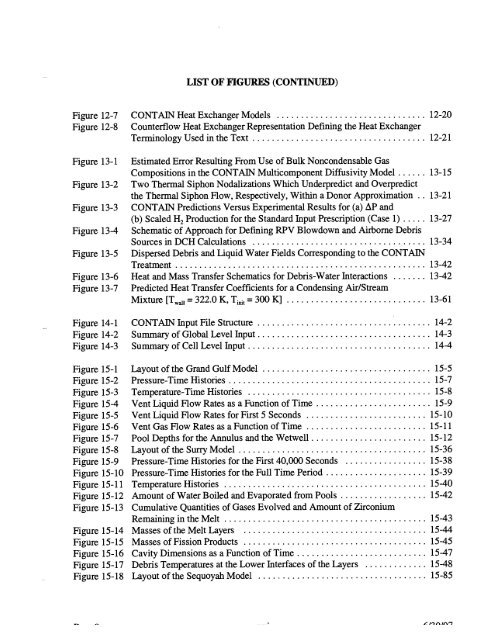
- Page 22 and 23: LIST OF FIGURES (CONCLUDED) Figure
- Page 24 and 25: LIST OF TABLES (CONCLUDED) Table 9-
- Page 27 and 28: 1.0 INTRODUCTION The CONTAIN code i
- Page 29 and 30: . respond under accident conditions
- Page 31 and 32: This code manual includes documenta
- Page 33 and 34: The intent of this document is to p
- Page 35: Table 1-3 Major New Models and Feat
- Page 38 and 39: Deposition/ Agglomeration Rates Hea
- Page 40 and 41: For completeness, the environment o
- Page 42 and 43: ilobal Loop zstart I Input * Loed N
- Page 44 and 45: Table 2-1 lists the internal timest
- Page 46 and 47: where p is the structure density, C
- Page 48 and 49: material definitions are given in t
- Page 50 and 51: water vapor, noncondensable gases (
- Page 52 and 53: 2.7 Aerosol Behavior Events occurri
- Page 54 and 55: In addition to these models, fissio
- Page 56 and 57: 2.10 Heat and Mass Transfer Through
- Page 58 and 59: diffusion of water and the released
- Page 60 and 61: primary system through a large ice
- Page 62 and 63: Gas Liquid ● argon ● nitrogen
- Page 64 and 65: Table 3-2 References for CONTAIN Ma
- Page 66 and 67: ● A common reference temperature,
- Page 68 and 69: where u$T,P) = h$T) = ~~TcP,f(T)dT
- Page 70 and 71:
Table 3-3 The Coefficients Aij in E
- Page 72 and 73:
To ensure that the extrapolation ha
- Page 74 and 75:
4. AssumWion of saturated intermedi
- Page 76 and 77:
output after a run is completed, th
- Page 79 and 80:
4.0 ATMOSPHERIVPOOL THERMODYNAMIC A
- Page 81 and 82:
o 0 *0-0 o +F-ooo 0000 Atmosphere G
- Page 83 and 84:
Am An HW ❑ Ht AI * HI= Hb Figure
- Page 85 and 86:
connected to the respective cells.
- Page 87 and 88:
A side-connected path is defined as
- Page 89 and 90:
4.3 ~ tion The flow modeling option
- Page 91 and 92:
FLOW option for overcoming the gas
- Page 93 and 94:
Table 4-2 Conservation of Momentum
- Page 95 and 96:
4.4.3 User-Specified Flow Rates The
- Page 97 and 98:
4.4.5 Gravitational Head Modeling T
- Page 99 and 100:
gas center-of-volume elevations, in
- Page 101 and 102:
crossover parameter y always select
- Page 103 and 104:
interface, since in CONTAIN materia
- Page 105 and 106:
where dmi ~ Table 4-3 Conservation
- Page 107 and 108:
where Table 4-3 Conservation of Mas
- Page 109 and 110:
Table 4-4 Conservation of Energy Eq
- Page 111 and 112:
Table 4-5 Conservation of Mass Equa
- Page 113 and 114:
Table 4-6 Conservation of Energy Eq
- Page 115 and 116:
architecture. A gas-pool equilibrat
- Page 117 and 118:
Finally, the mass transfer rate of
- Page 119 and 120:
where Ap~jis the area of the atmosp
- Page 121 and 122:
The FIX-FLOW option may be useful i
- Page 123 and 124:
exit losses and other fictional los
- Page 125:
. Pressure: where Pi = 2 k=l Table
- Page 128 and 129:
CCIS are modeled through an embedde
- Page 130 and 131:
~ Boiling \t/ o 0: O.” 0°0000 .O
- Page 132 and 133:
the pool layer should lie on top of
- Page 134 and 135:
modeled will include the scrubbing
- Page 136 and 137:
ebar using the RBRCOMP keyword. Con
- Page 138 and 139:
aerosol release model. The allowabl
- Page 140 and 141:
Keyword Chemical Symbol Table 5-4 M
- Page 142 and 143:
The coolant pool layer is unique in
- Page 144 and 145:
water and regarding heat transfer a
- Page 146 and 147:
options is directed to the fwst nod
- Page 148 and 149:
5.6.2 External Lower Cell Material
- Page 150 and 151:
CONTAIN Code Main Modules CONTAIN I
- Page 152 and 153:
5.7.5 Restrictions in Mass and Ener
- Page 154 and 155:
Both gas-phase and condensed-phase
- Page 156 and 157:
decay power calculated in the DECAY
- Page 158 and 159:
5.8.15 Energy Conservation (2.3.12
- Page 160 and 161:
4. 5. 6. 7. 8. 9. imposed on it by
- Page 163 and 164:
6.0 DIRECT CONTAINMENT HEATING (DCH
- Page 165 and 166:
● ● ● “. . . . . ● ☞✍
- Page 167 and 168:
evolve independently of the other d
- Page 169 and 170:
The combined mass flow rate of gas
- Page 171 and 172:
where ,=W Ipgu+wi Note that when al
- Page 173 and 174:
‘ig,i,k _ — — ~‘jiwji$ ‘g
- Page 175 and 176:
entering directly into the atmosphe
- Page 177 and 178:
airborne particles can be neglected
- Page 179 and 180:
1. Conventional atmospheric source
- Page 181 and 182:
ecommended that the user review Ref
- Page 183 and 184:
The heat transfer coefficient betwe
- Page 185 and 186:
other versions of the Whalley-Hewit
- Page 187 and 188:
6.2.10.2 Entrained Fraction Correla
- Page 189 and 190:
and [) y+l y+l f(y) = yo”s ~ 2 (y
- Page 191 and 192:
ecause the desired fraction of debr
- Page 193 and 194:
pdv; NWe=— C! (6-71) where NW.is
- Page 195 and 196:
Equations (6-73) and (6-74) may all
- Page 197 and 198:
dmd’ ,, ~ +[+” rpv,s [1 ‘t en
- Page 199 and 200:
Tin = v.=— g,ln Z ‘g,ji6jiTg,jc
- Page 201 and 202:
An important aspect of the CONTAIN
- Page 203 and 204:
6.3.6 TOF/KU Trapping Model Like th
- Page 205 and 206:
whose default value is 0.32, p~jis
- Page 207 and 208:
The flight time and average velocit
- Page 209 and 210:
If slip is ignored completely, then
- Page 211 and 212:
Zr +2HZ0 + Z@z+2Hz L Fe+ H20 “ zr
- Page 213 and 214:
The Reynolds and Schmidt dimensionl
- Page 215 and 216:
D H20 = 4.40146 X 10⁻⁶ (T~~)2334 P
- Page 217 and 218:
.. 1-exp -~ = 0.5 [} ‘d where t~o
- Page 219 and 220:
AN~~, = N& 1- exp -— ‘re [{IIAt
- Page 221 and 222:
(AI-120)i,n= (~)~oAtC Am,j,.,,=-((A
- Page 223 and 224:
where ~~,i,. = (AO&hO~P&i,n) + (AH2
- Page 225 and 226:
calculated intercell mass flow rate
- Page 227 and 228:
The total radiative energy loss fro
- Page 229:
The velocity for non-airborne debri
- Page 232 and 233:
UK ~ DSolid Aerosol Water [ A Spray
- Page 234 and 235:
● particle scrubbing from gases v
- Page 236 and 237:
too small by evaporation of water.
- Page 238 and 239:
(7-3) where d(&(t)/dt is the time r
- Page 240 and 241:
This constraint thus reduces the nu
- Page 242 and 243:
particles can combine at a time. Th
- Page 244 and 245:
Except when they include significan
- Page 246 and 247:
Table 7-1 Comparison Between Fixed-
- Page 248 and 249:
Figure 7-3. Model for Water Condens
- Page 250 and 251:
The condensation Reference Pru78: r
- Page 252 and 253:
DiffusioDhoresi$. When water conden
- Page 254 and 255:
the user may specify these paramete
- Page 256 and 257:
The settling area ~ is the sum of a
- Page 258 and 259:
The effective cylindrical diameter
- Page 260 and 261:
where St is the Stokes number, the
- Page 262 and 263:
100 1 ()-1 10-2 1()-3 10-4 ‘\ Tot
- Page 264 and 265:
and Potential Flow: ELP E ll,p = =
- Page 266 and 267:
The efilciency E of a spray drop ch
- Page 268 and 269:
with enhanced scrubbing) or a small
- Page 270 and 271:
As an example of difficulties that
- Page 272 and 273:
,. - 137c~ / \ P- w 137M Ba 1 137Ba
- Page 274 and 275:
user. From this information, the co
- Page 276 and 277:
No. 7 No. 8 No. 9 No. 10 No. 11 No.
- Page 278 and 279:
~- ~- No. 19 l~R” —> 106Rh~ 106
- Page 280 and 281:
No. 28 No. 29 No. 30 No. 31 No. 32
- Page 282 and 283:
with the host. In such cases, the f
- Page 284 and 285:
103Rhbranch as in the second chain
- Page 286 and 287:
and B2, respectively, differing onl
- Page 288 and 289:
Table 8-3 Fission Product Library -
- Page 290 and 291:
inventory and for time-dependent so
- Page 292 and 293:
[Lee80] Note that array space for t
- Page 294 and 295:
I GAS UC Atmosphere Heat +%.OOO 00
- Page 296 and 297:
where t is the problem time in seco
- Page 298 and 299:
where V~ is the drop volume, which
- Page 300 and 301:
supplied by the library. Such inven
- Page 302 and 303:
The governing equation for the chan
- Page 304 and 305:
s DFB is assumed to occur whenever
- Page 306 and 307:
The chemical reactions that occur d
- Page 308 and 309:
up before ignition occurs. For exam
- Page 310 and 311:
delay factor is too small, the tota
- Page 312 and 313:
The deflagration model assumes that
- Page 314 and 315:
The above correlations assume only
- Page 316 and 317:
to occur in the bum model at a reas
- Page 318 and 319:
where At~,is the remaining bum time
- Page 320 and 321:
Specifically, for DFB to occur, the
- Page 322 and 323:
where NtOti= N~ + N~o + ~ is the to
- Page 324 and 325:
wheres, is the user-specified spont
- Page 326 and 327:
—’ - ● *4 / hMl Outgassing St
- Page 328 and 329:
prior to CONTAIN 1.2, there is cons
- Page 330 and 331:
except for the error introduced by
- Page 332 and 333:
0.1 0.08 0.06 0.04 ~ 0.02 h G o s .
- Page 334 and 335:
Nk = ~BLcp,BLABL h = kB~N~u/L (10-1
- Page 336 and 337:
unsubmerged surface of the structur
- Page 338 and 339:
‘=4Hpi-Hb’iF$l (10-15) e where
- Page 340 and 341:
to simulate forced convection throu
- Page 342 and 343:
10.1.3 Generalized Gas-Structure Co
- Page 344 and 345:
Note that the default correlations
- Page 346 and 347:
Because the heat and mass transfer
- Page 348 and 349:
0.01 0.001 0.0001 0.00001 temperatu
- Page 350 and 351:
0.01 0.001 0.0001 0.00001 ~emperatu
- Page 352 and 353:
default correlations with ones of t
- Page 354 and 355:
The film tracking model is discusse
- Page 356 and 357:
this limit would correspond to a fi
- Page 358 and 359:
follows the standard recommendation
- Page 360 and 361:
In Equation (10-54) the relation 6
- Page 362 and 363:
where N is the number of the surfac
- Page 364 and 365:
X= XO-b At, AT (lo-66) where X“is
- Page 366 and 367:
The ernissivity of each of the abov
- Page 368 and 369:
The term ~ in Equation (10-80) is t
- Page 370 and 371:
coolant subcooling. The various cor
- Page 372 and 373:
If boiling is occurring at the inte
- Page 374 and 375:
‘TL.eid,s.b = ATbid + 8 AT,ub (10
- Page 376 and 377:
Concrete Air Figure 10-8. Cylindric
- Page 378 and 379:
where k is the thermal conductivity
- Page 380 and 381:
T 2,eff = T2 h I,eff = hlz whereas
- Page 382 and 383:
extrapolated temperature as defined
- Page 384 and 385:
Distance ~ ~ Surface Node ~ Nodei F
- Page 386 and 387:
The interface temperature Oihas sti
- Page 388 and 389:
to be reduced in proportion to this
- Page 390 and 391:
fde, TAPE17, to the effect that the
- Page 392 and 393:
The outgassing of evaporable water
- Page 394 and 395:
Gas Film Boundary Layer Bulk \& I A
- Page 396 and 397:
interface temperature. Note that co
- Page 398 and 399:
● heat transfer between the atmos
- Page 400 and 401:
Reactor Pressure Vessel Drywell Sou
- Page 402 and 403:
Figure 11-2. CONTAIN Multi-Node Ven
- Page 404 and 405:
L“ ●LO n ‘n I ,a ,rn n I I I
- Page 406 and 407:
Table 11-1 Example Solution for Flo
- Page 408 and 409:
IDrywell Water Vapor and Gas Source
- Page 410 and 411:
—= dx — dt F Pq 1 2[pd - ‘w +
- Page 412 and 413:
Drywell, Pd Ii P(f> Pw Vent Vd =
- Page 414 and 415:
For flow from wetwell to drywell, a
- Page 416 and 417:
Aeff =4 for AP > APU where ~ is the
- Page 418 and 419:
the component hosting the fission p
- Page 420 and 421:
noncondensable gases multiplied by
- Page 423 and 424:
12.0 ENGINEERED SAFETY FEATURE MODE
- Page 425 and 426:
~ Spray Flow Path ~~ Reinforced Con
- Page 427 and 428:
Inlet Manifold Cold Side Hot Side C
- Page 429 and 430:
other than air or superheated condi
- Page 431 and 432:
Because the total heat transferred
- Page 433 and 434:
7 Plenum t Ice Compartment 1 Accumu
- Page 435 and 436:
spring or gravity-controlled motion
- Page 437 and 438:
conditions. If “citlex” does no
- Page 439 and 440:
where p~is the atmosphere gas mixtu
- Page 441 and 442:
In these equations, N~~is the drop
- Page 443 and 444:
Figure 12-8. Th,o ~b Cold Leg (Outl
- Page 445 and 446:
The capacity-rate ratio CR is defin
- Page 447 and 448:
Note that the user-specified pump m
- Page 449 and 450:
13.0 USER GUIDANCE AND PRACTICAL AN
- Page 451 and 452:
small flow areas. Also, in the mome
- Page 453 and 454:
13.2.4 Aerosol Modeling ~t. The aer
- Page 455 and 456:
~s. The heat given off by many radi
- Page 457 and 458:
concentration in the cell maybe hig
- Page 459 and 460:
In comparisons with experimental re
- Page 461 and 462:
It is normally considered inappropr
- Page 463 and 464:
0.00016 0.00014 0.00012 0.0001 8E-0
- Page 465 and 466:
13.2.9 Calculational Sequence Effec
- Page 467 and 468:
13.3.1.3 Modelin~ Stratifications.
- Page 469 and 470:
Figure 13-2. Two Thermal Siphon Nod
- Page 471 and 472:
for the Sequoyah plant given in Cha
- Page 473 and 474:
— uses CONTAIN. In any given anal
- Page 475 and 476:
0.4 0.3 0.2 0.1 (a) / ~ ..” ~ ●
- Page 477 and 478:
Table 13-1 Summary of the CONTAIN S
- Page 479 and 480:
0.4 1J- 2 6.3 d# p“ RPV (13-1) He
- Page 481 and 482:
1. Use Equation (13-1) to define z~
- Page 483 and 484:
In the standard prescription, the c
- Page 485 and 486:
as small pipes, cabling, etc. Impac
- Page 487 and 488:
esulting from homogenizing cool age
- Page 489 and 490:
equivalent to that of the liquid wa
- Page 491 and 492:
called “tarnping.” Since aeroso
- Page 493 and 494:
Co-Eiected Primarv Svstem Water. Wa
- Page 495 and 496:
.- If the initial atmosphere compos
- Page 497 and 498:
hybrid solver was not available at
- Page 499 and 500:
13.3.2.3 RPV Models. When the RPV a
- Page 501 and 502:
other governing input parameters. I
- Page 503 and 504:
and Griffith. ~i196] In addition, t
- Page 505 and 506:
several reasons, the assessment per
- Page 507 and 508:
area. It is recommended that the us
- Page 509 and 510:
800 700 600 500 400 300 200 100 0 \
- Page 511 and 512:
heat flow under conditions of nearl
- Page 513 and 514:
dumped into a layer in a short time
- Page 515 and 516:
Comments at the begiming of an inpu
- Page 517:
— cannot be modeled directly. How
- Page 520 and 521:
CELL, must follow the global input.
- Page 522 and 523:
CELL 1 && beginning of input for ce
- Page 524 and 525:
In the following input descriptions
- Page 526 and 527:
A sub-block thus can begin with a l
- Page 528 and 529:
The global CONTROL block is used to
- Page 530 and 531:
NENGV = nengv NWDUDM = nwdudm NMTRA
- Page 532 and 533:
table may be specified after the CO
- Page 534 and 535:
COMPOUND keyword. Such names need n
- Page 536 and 537:
RHOT density values, paired with th
- Page 538 and 539:
correspond to the species as they a
- Page 540 and 541:
14.2.4 Intercell Flows be considere
- Page 542 and 543:
nat the number of cell atmospheres
- Page 544 and 545:
cellfr the number of the cell from
- Page 546 and 547:
VTOPEN = vtopen TYPE = {GAS or POOL
- Page 548 and 549:
RVAREA-P the keyword for initiating
- Page 550 and 551:
NWET the number of the cell contain
- Page 552 and 553:
(NAME=aname [FLAG=iflag] X=n (x) VA
- Page 554 and 555:
keyword will result in the oversize
- Page 556 and 557:
SURTEN the surface tension of a wet
- Page 558 and 559:
newcof = 2: Coefficients are reques
- Page 560 and 561:
FINVT = (finvt) (8-5). If FGPPWR is
- Page 562 and 563:
In the input block description of t
- Page 564 and 565:
FDISTR = (fdistr) FDEVEN GRPLIM = g
- Page 566 and 567:
DIFH20 the multiplier on the mass t
- Page 568 and 569:
AHOLE1 the initial hole size in the
- Page 570 and 571:
IENFRA = ienfra AFLOW = aflow AHENF
- Page 572 and 573:
WESIG the natural logarithm of the
- Page 574 and 575:
The EDMULT keyword is useful for re
- Page 576 and 577:
PRBURN a keyword which invokes the
- Page 578 and 579:
tfac exactly “ncells”values spe
- Page 580 and 581:
14.3 Cell Level Input The cell is t
- Page 582 and 583:
a pool layer will form in the cours
- Page 584 and 585:
NSOSAT the number of safety relief
- Page 586 and 587:
GASVOL = gasvol CELLHIST n hl, area
- Page 588 and 589:
Presently, DCH and other nongaseous
- Page 590 and 591:
xmass the mass of species “oname
- Page 592 and 593:
ATMOS=3 EOI PGAS=l.0E5 TGAS=335 SAT
- Page 594 and 595:
[INIDEPTH=indpth] [MINDEPTH=rnndpth
- Page 596 and 597:
STRUC CRANK = crank OUTGAS TRANGE t
- Page 598 and 599:
kco2 eco2 QH20E = qh20e QH20B = qh2
- Page 600 and 601:
cYLHn-’E the axial length of a cy
- Page 602 and 603:
FORCOR1 =a3b3c3 d3 FORCOR2 =a4b4c4
- Page 604 and 605:
VELOCITY, REY-NUM, and NUS-FORC are
- Page 606 and 607:
whether net condensation or evapora
- Page 608 and 609:
cylinder. Here, RI is the cylinder
- Page 610 and 611:
istr hgap ICELL = icell TGAS = tgas
- Page 612 and 613:
14.3.1.5 Radiation. The radiation m
- Page 614 and 615:
eaml EOI GASWAL = gaswal GEOBL geob
- Page 616 and 617:
Table 14-1 Types of Bums Allowed fo
- Page 618 and 619:
0.0376. Thekeyword CFRMNGserves the
- Page 620 and 621:
DEBCONC the concentration of debris
- Page 622 and 623:
14.4.1. The particle size distribut
- Page 624 and 625:
14.3.1.10 Fission Product Initial C
- Page 626 and 627:
FROM = marne TO = aname “mame”
- Page 628 and 629:
The following keywords and associat
- Page 630 and 631:
LENGFT = xleng KU1 = xku 1 KU2 = xk
- Page 632 and 633:
and the DIATR4P, VELTRAP, and IL4.D
- Page 634 and 635:
(data) EOIl [CONCRETE (data) EOIl (
- Page 636 and 637:
EOI [Q235U=q235u] [Q238U=q238u] [Q2
- Page 638 and 639:
EOI EOIl T=(times) MASS=(masses) {T
- Page 640 and 641:
HT-COEF NAME olay oxopt nh xhtval h
- Page 642 and 643:
EOI EOI [USERSENS [{HXBOTCOR ahtb b
- Page 644 and 645:
RBRCOMP ometl fmfrac EOI cmass TEMP
- Page 646 and 647:
w the outside radius of the cylinde
- Page 648 and 649:
SLAGSIDE a keyword which enables th
- Page 650 and 651:
HBOILFLX = nhb dtsat bflx HBOILMUL
- Page 652 and 653:
RHOOMUL = rhomul TSOMLT = tsomlt XE
- Page 654 and 655:
DETAIL nvcons ovnam nfp ofpnam wfra
- Page 656 and 657:
into CONTAIN. The obsolete VANESA k
- Page 658 and 659:
SOURCE nso Q-VOL HT-COEF the keywor
- Page 660 and 661:
smo TMETAL = tmi TOXIDE = toi LAYER
- Page 662 and 663:
METALPWR the keyword to begin speci
- Page 664 and 665:
14.3.3 Engineered Safety Systems Th
- Page 666 and 667:
iclin iclout delev now automaticall
- Page 668 and 669:
FCFLAR the frontal area of the fan
- Page 670 and 671:
DIAMDIF the effective wire cylindri
- Page 672 and 673:
hxarea the effective heat transfer
- Page 674 and 675:
PIPE the keyword to specify a pipe
- Page 676 and 677:
EOI (oaer=na [IFLAG=ival] [AMEAN=(m
- Page 678 and 679:
SOURCE nsosfp Ofp nf HOST = nhost C
- Page 680 and 681:
with standard keywords. Thus the pr
- Page 682 and 683:
encountered. Aerosol suspended mass
- Page 684 and 685:
EOI the keyword used to terminate e
- Page 686 and 687:
[PRFLOW [{ON or OFF}]] [PRAER [{ON
- Page 688 and 689:
14.5.1.1 The TIMES Block in a Resta
- Page 690 and 691:
AEROSOL a keyword sequence to speci
- Page 693 and 694:
15.0 SAMPLE PLANT CALCULATIONS In t
- Page 695 and 696:
Table 15-1 Grand Gulf Input File (C
- Page 697 and 698:
— o1 DRYWELL t o2 ANNULUS Figure
- Page 699 and 700:
. 2 190 PO o - 170 aJ L 3 In (n a)
- Page 701 and 702:
3 0 r w.- 3 0- .- _d 120 100 80 60
- Page 703 and 704:
8 7 1 0 % :k I I i I I I I I I I 1
- Page 705 and 706:
15.2 Surry Plant In the second samp
- Page 707 and 708:
Table 15-2 Surry Input File (Contin
- Page 709 and 710:
Table 15-2 Surry Input File (Contin
- Page 711 and 712:
Table 15-2 Surry Input File (Contin
- Page 713 and 714:
Table 15-2 Surry Input File (Contin
- Page 715 and 716:
Table 15-2 Surry Input File (Contin
- Page 717 and 718:
Table 15-2 Surry Input File (Contin
- Page 719 and 720:
Table 15-2 Surry Input File (Contin
- Page 721 and 722:
Table 15-2 Surry Input File (Contin
- Page 723 and 724:
Table 15-2 Surry Input File (Contin
- Page 725 and 726:
mass= O.OOOOOe+OO 1.45045e+Ol 1.438
- Page 727 and 728:
3.05000e-01 eoi Table 15-2 Surry In
- Page 729 and 730:
concrete in the cavity and thus the
- Page 731 and 732:
500 450 400 350 300 250 200 150 100
- Page 733 and 734:
-. The amount of water boiled and e
- Page 735 and 736:
.- 1.0 0.9 0.8 0.7 0.6 0.5 0.4 0.3
- Page 737 and 738:
c .— s o .- rn (J-J K 1 0+2 10-3
- Page 739 and 740:
5.0 4.8 4.6 4.4 4.2 4.0 3.8 3.6 3.4
- Page 741 and 742:
Table 15-3 Sequoyah Input File && -
- Page 743 and 744:
Table 15-3 Sequoyah Input File (Con
- Page 745 and 746:
2.8000e+Ol 2.8000e+Ol 2.8000e+Ol en
- Page 747 and 748:
8.0500e+02 8.0650e+02 eoi feed debr
- Page 749 and 750:
eoi 1.0000e+Ol 1.0000e+Ol 1.0000e+O
- Page 751 and 752:
Table 15-3 Sequoyah Input File (Con
- Page 753 and 754:
eoi Table 15-3 Sequoyah Input File
- Page 755 and 756:
Table 15-3 Sequoyah Input File (Con
- Page 757 and 758:
Table 15-3 Sequoyah Input File (Con
- Page 759 and 760:
Table 15-3 Sequoyah Input File (Con
- Page 761 and 762:
Table 15-3 Sequoyah Input File (Con
- Page 763 and 764:
eoi 4.30918e+06 4.34125e+06 4.52691
- Page 765 and 766:
Table 15-3 Sequoyah Input File (Con
- Page 767 and 768:
eoi 1.55497e+07 1.58464e+07 1.65145
- Page 769 and 770:
Table 15-3 Sequoyah Input File (Con
- Page 771 and 772:
var-y=diatrap eoi trapping to fku &
- Page 773 and 774:
Table 15-3 Sequoyah Input File (Con
- Page 775 and 776:
Table 15-3 Sequoyah Input File (Con
- Page 777 and 778:
o 8 w s H I E 5 UP Co L I D 3’ 4
- Page 779 and 780:
Table 15-4 Sequoyah Restart Input F
- Page 781 and 782:
.. Table 15-4 Sequoyah Restart Inpu
- Page 783 and 784:
eoi dch-cell sdeven= 1.0 && default
- Page 785 and 786:
Table 15-4 Sequoyah Restart Input F
- Page 787 and 788:
compartment. The subsequent upward
- Page 789 and 790:
350 I I I I I I I i I I I i 325 300
- Page 791 and 792:
80 70 60 50 40 30 20 10 ? i I i / /
- Page 793 and 794:
combustion as calculated by the hyd
- Page 795 and 796:
16.1 Introduction 16.0 OUTPUT FILES
- Page 797 and 798:
will report conditions that might h
- Page 799 and 800:
To achieve this objective, POSTCON
- Page 801 and 802:
typically very undescriptive, a sho
- Page 803 and 804:
Table 16-1 Item Keywords (Continued
- Page 805 and 806:
Table 16-1 Item Keywords (Continued
- Page 807 and 808:
Table 16-1 Item Keywords (Continued
- Page 809 and 810:
Table 16-1 Item Keywords (Continued
- Page 811 and 812:
Table 16-2 Default Conversion Facto
- Page 813 and 814:
16.3.4.1 Simzle Pass. For simple pr
- Page 815 and 816:
16.4.1.3 Bin ary Plot File (PLTFIL)
- Page 817 and 818:
16.5 COntrol Block The general stru
- Page 819 and 820:
MAXSNI? keyword that initiates inpu
- Page 821 and 822:
EOI termination for the entire cont
- Page 823 and 824:
VECTOR ovname keyword that initiate
- Page 825 and 826:
EOF keyword thatterminates theendof
- Page 827 and 828:
POSTCON routine, and possibly writi
- Page 829 and 830:
Three units are converted in this e
- Page 831 and 832:
pltfil=plotl pout=poutl pvec=pvecl
- Page 833 and 834:
&& poet snapshot vector for flag: 5
- Page 835 and 836:
Figure 16-9. PMIX1 File from Exampl
- Page 837 and 838:
cell=2 vector=mettmp layer=3 type=t
- Page 839:
16.10.3 Output Handling When a user
- Page 842 and 843:
Ben84 Ber85a Ber85b Ber86 Bi193 Bin
- Page 844 and 845:
Dhi78 Din86 Dui89 Dun84 Edw73 E1w62
- Page 846 and 847:
Hin82 H068 H0168 Hot67 HUS88 Ide60
- Page 848 and 849:
Low82 Lui83 Lut91 Mak70 Mar86 Mas58
- Page 850 and 851:
Pi195 Pi196 Pit89 Pon90 POW86 POW93
- Page 852 and 853:
Sum95 Ta180 Tam85 Tarn87 Tam88 Tar8
- Page 854 and 855:
was95 Wea85 Web92 Wei72 Wha78 Wi187
- Page 857 and 858:
A. 1 Introduction APPENDIX A DETAIL
- Page 859 and 860:
thermodynamic states. However, the
- Page 861 and 862:
= h~(T) (for non-coolant liquids, s
- Page 863 and 864:
(A-4) where N~X~j is the number of
- Page 865 and 866:
.. in the liquid and vapor enthalpi
- Page 867 and 868:
APPENDIX B 1 ALTERNATE INPUT FORMAT
- Page 869 and 870:
.- AREA,i,j = area AVL,i,j = avl CF
- Page 871 and 872:
n x PDAFLAG keyword discussed above
- Page 873 and 874:
parameter string, the redefined val
- Page 875 and 876:
RELEASE specifies nontargeted relea
- Page 877 and 878:
nraycc number of rays used to model
- Page 879 and 880:
ishape nslab ibc tint Chrl vufac bc
- Page 881 and 882:
keywords FLAG, X, and Y are given i
- Page 883 and 884:
C. 1 Introduction APPENDIX C VALIDA
- Page 885 and 886:
Validation is considered outside th
- Page 887 and 888:
2) Medium = prediction of prime qua
- Page 889 and 890:
C.3.4 Aerosol Behavior Table C-7 pr
- Page 891 and 892:
product behavior, it can be used to
- Page 893 and 894:
Table C-1 CONTAIN Code Release Hist
- Page 895 and 896:
Table C-3 Validation Matrix for Atm
- Page 897 and 898:
Table C-3 Validation Matrix for Atm
- Page 899 and 900:
Table C-3 Validation Matrix for Atm
- Page 901 and 902:
Table C-3 Validation Matrix for Atm
- Page 903 and 904:
Table C-3 Validation Matrix for Atm
- Page 905 and 906:
Table C-4 Validation Matrix for Hea
- Page 907 and 908:
Table C-5 Validation Matrix for Hea
- Page 909 and 910:
I Validation Type/Basis Separate ef
- Page 911 and 912:
Table C-6 Validation Matrix for DCH
- Page 913 and 914:
Table C-6 Validation Matrix for DCH
- Page 915 and 916:
Experiment (Test Facility) SNLJIET-
- Page 917 and 918:
(Footnotes for Table C-6 Continued)
- Page 919 and 920:
Table C-7 Validation Matrix for Aer
- Page 921 and 922:
Table C-8 Validation Matrix for Hyd
- Page 923 and 924:
Table C-10 Validation Matrix for Mi
- Page 925 and 926:
n 400 ) 300 % $ 200 ~ * o 6 100 * z
- Page 927 and 928:
~ ~ 0.10 0.08 g 0.06 a fn g n g 0.0
- Page 929 and 930:
g 403 393 383 373 363 353 343 333 3
- Page 931 and 932:
Has96b Hei86 Huh93 Jac89 Jon87 Jon8
- Page 933 and 934:
Mur83b Mur88 Mur89 Mur96 0wc85 Pet9
- Page 935 and 936:
Ti191 Ti196 Uch65 Va183 va188 Ver87
- Page 937 and 938:
D. 1 Introduction APPENDIX D QUALIT
- Page 939 and 940:
L==I-----F -—— - L I I I Desk M
- Page 941 and 942:
Ir Lo! (o) Releases \ II T ata chan
- Page 943 and 944:
the difilculty, resolving the issue
- Page 945 and 946:
When the review is complete, the up
- Page 947 and 948:
● ensures that modifications will
- Page 949 and 950:
-. . ---ula GMF Program Library \ O
- Page 951 and 952:
instruction set that creates the va
- Page 953 and 954:
experimental results. The objective
- Page 955 and 956:
D.2.6.4 Test Doc umentation. In eve
- Page 957 and 958:
REFERENCES Bi194 S. C. Billups et a
- Page 960:
4 QPrinted on recycled paper Federa


