camp ripley and arden hills minnesota army national guard training ...
camp ripley and arden hills minnesota army national guard training ...
camp ripley and arden hills minnesota army national guard training ...

Create successful ePaper yourself
Turn your PDF publications into a flip-book with our unique Google optimized e-Paper software.
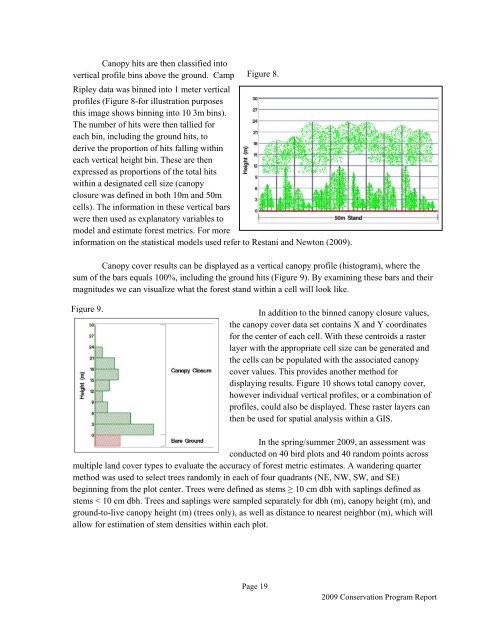
Canopy hits are then classified into<br />
vertical profile bins above the ground. Camp<br />
Ripley data was binned into 1 meter vertical<br />
profiles (Figure 8-for illustration purposes<br />
this image shows binning into 10 3m bins).<br />
The number of hits were then tallied for<br />
each bin, including the ground hits, to<br />
derive the proportion of hits falling within<br />
each vertical height bin. These are then<br />
expressed as proportions of the total hits<br />
within a designated cell size (canopy<br />
closure was defined in both 10m <strong>and</strong> 50m<br />
cells). The information in these vertical bars<br />
were then used as explanatory variables to<br />
model <strong>and</strong> estimate forest metrics. For more<br />
information on the statistical models used refer to Restani <strong>and</strong> Newton (2009).<br />
Canopy cover results can be displayed as a vertical canopy profile (histogram), where the<br />
sum of the bars equals 100%, including the ground hits (Figure 9). By examining these bars <strong>and</strong> their<br />
magnitudes we can visualize what the forest st<strong>and</strong> within a cell will look like.<br />
Figure 9.<br />
Figure 8.<br />
In addition to the binned canopy closure values,<br />
the canopy cover data set contains X <strong>and</strong> Y coordinates<br />
for the center of each cell. With these centroids a raster<br />
layer with the appropriate cell size can be generated <strong>and</strong><br />
the cells can be populated with the associated canopy<br />
cover values. This provides another method for<br />
displaying results. Figure 10 shows total canopy cover,<br />
however individual vertical profiles, or a combination of<br />
profiles, could also be displayed. These raster layers can<br />
then be used for spatial analysis within a GIS.<br />
In the spring/summer 2009, an assessment was<br />
conducted on 40 bird plots <strong>and</strong> 40 r<strong>and</strong>om points across<br />
multiple l<strong>and</strong> cover types to evaluate the accuracy of forest metric estimates. A w<strong>and</strong>ering quarter<br />
method was used to select trees r<strong>and</strong>omly in each of four quadrants (NE, NW, SW, <strong>and</strong> SE)<br />
beginning from the plot center. Trees were defined as stems ≥ 10 cm dbh with saplings defined as<br />
stems < 10 cm dbh. Trees <strong>and</strong> saplings were sampled separately for dbh (m), canopy height (m), <strong>and</strong><br />
ground-to-live canopy height (m) (trees only), as well as distance to nearest neighbor (m), which will<br />
allow for estimation of stem densities within each plot.<br />
Page 19<br />
2009 Conservation Program Report