Vaporization of JP-8 Jet Fuel in a Simulated Aircraft Fuel Tank ...
Vaporization of JP-8 Jet Fuel in a Simulated Aircraft Fuel Tank ...
Vaporization of JP-8 Jet Fuel in a Simulated Aircraft Fuel Tank ...

Create successful ePaper yourself
Turn your PDF publications into a flip-book with our unique Google optimized e-Paper software.
Temperature, Deg. F.<br />
70<br />
60<br />
50<br />
40<br />
30<br />
20<br />
10<br />
0<br />
Thermocouple<br />
Error<br />
0 1000 2000 3000 4000 5000<br />
Time, seconds<br />
FID Error<br />
Liquid Temp<br />
Measured THC<br />
Calculated THC, 115 FP<br />
Calculated THC, 120 FP<br />
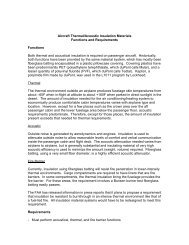
Figure 5.12. <strong>Fuel</strong> heat<strong>in</strong>g at 30,000’ altitude, 4.6 psia; <strong>in</strong>put fuel temperature and comparison <strong>of</strong><br />
calculated and measured ullage vapor concentrations, M.L.=31.5kg/m 3 .<br />
5.3 <strong>JP</strong>-8 Tests with <strong>Simulated</strong> Flight Conditions<br />
As mentioned earlier, simulated flight conditions consisted <strong>of</strong> one hour <strong>of</strong> ground time<br />
with fuel tank heat<strong>in</strong>g from the bottom surface, an ascent at 1,000 feet per m<strong>in</strong>ute to the<br />
desired cruis<strong>in</strong>g altitude (10,000’, figure 5.12, 20,000’, figure 5.14, 30,000’, figure 5.16),<br />
cruise at this altitude for one hour, descent at –1,000 feet per m<strong>in</strong>ute to sea level, and<br />
f<strong>in</strong>ally several m<strong>in</strong>utes at ground level. Ambient temperature pr<strong>of</strong>iles were based on<br />
weather data from Unisys constant height temperature plots <strong>of</strong> the United States.<br />
Although the conditions used <strong>in</strong> this part <strong>of</strong> the experimentation were not identical to the<br />
exact fuel tank conditions <strong>in</strong> an aircraft, they did provide a good <strong>in</strong>dication <strong>of</strong> the<br />
conditions occurr<strong>in</strong>g dur<strong>in</strong>g flight <strong>in</strong> a typical aircraft fuel tank. The results from the<br />
simulated flight pr<strong>of</strong>ile tests, <strong>in</strong>clud<strong>in</strong>g the environmental flight conditions and ullage<br />
vapor concentration comparisons are shown <strong>in</strong> figures 5.12 – 5.17.<br />
Figures 5.13, 5.15, and 5.16 show a comparison between calculated and measured<br />
ullage vapor concentrations for three flight scenarios with cruises at 10,000’, 20,000’, and<br />
2<br />
1.5<br />
1<br />
0.5<br />
0<br />
% Propane Equivalent<br />
42