
You also want an ePaper? Increase the reach of your titles
YUMPU automatically turns print PDFs into web optimized ePapers that Google loves.
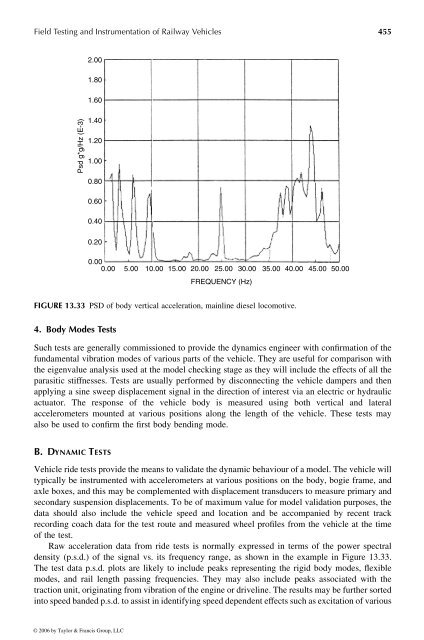
Field Testing and Instrumentation <strong>of</strong> <strong>Railway</strong> <strong>Vehicle</strong>s 455<br />
Psd g*g/Hz (E-3)<br />
2.00<br />
1.80<br />
1.60<br />
1.40<br />
1.20<br />
1.00<br />
0.80<br />
0.60<br />
0.40<br />
0.20<br />
4. Body Modes Tests<br />
Such tests are generally commissioned toprovide the dynamics engineer with confirmation <strong>of</strong> the<br />
fundamental vibration modes <strong>of</strong> various parts <strong>of</strong> the vehicle. They are useful for comparison with<br />
the eigenvalue analysis used at the model checking stage as they will include the effects <strong>of</strong> all the<br />
parasitic stiffnesses. Tests are usually performed by disconnecting the vehicle dampers and then<br />
applying asine sweep displacement signal in the direction <strong>of</strong> interest via an electric or hydraulic<br />
actuator. The response <strong>of</strong> the vehicle body is measured using both vertical and lateral<br />
accelerometers mounted at various positions along the length <strong>of</strong> the vehicle. These tests may<br />
also be used to confirm the first body bending mode.<br />
B. D YNAMIC T ESTS<br />
0.00 0.00 5.00 10.00 15.00 20.00<br />
25.00 30.00 35.00 40.00 45.00 50.00<br />
FREQUENCY (Hz)<br />
FIGURE 13.33 PSD <strong>of</strong> body vertical acceleration, mainline diesel locomotive.<br />
<strong>Vehicle</strong> ride tests providethe means to validate the dynamic behaviour <strong>of</strong> amodel. The vehicle will<br />
typically beinstrumented with accelerometers at various positions on the body, bogie frame, and<br />
axle boxes, and this may be complemented with displacement transducers to measure primary and<br />
secondary suspension displacements. To be <strong>of</strong> maximum value for model validation purposes, the<br />
data should also include the vehicle speed and location and be accompanied by recent track<br />
recording coach data for the test route and measured wheel pr<strong>of</strong>iles from the vehicle at the time<br />
<strong>of</strong> the test.<br />
Raw acceleration data from ride tests is normally expressed interms <strong>of</strong> the power spectral<br />
density (p.s.d.) <strong>of</strong> the signal vs. its frequency range, asshown inthe example in Figure 13.33.<br />
The test data p.s.d. plots are likely toinclude peaks representing the rigid body modes, flexible<br />
modes, and rail length passing frequencies. They may also include peaks associated with the<br />
traction unit, originating from vibration <strong>of</strong> the engine or driveline.The results may be further sorted<br />
into speed banded p.s.d. to assist in identifying speed dependent effects such as excitation <strong>of</strong> various<br />
© 2006 by Taylor & Francis Group, LLC