
You also want an ePaper? Increase the reach of your titles
YUMPU automatically turns print PDFs into web optimized ePapers that Google loves.
430<br />
applications. They generally exhibit no phase shift at low frequencies, are insensitive to thermal<br />
effects and electro-magnetic interference, have ahigh signal to noise ratio and alow transverse<br />
sensitivity, typically around 1%.<br />
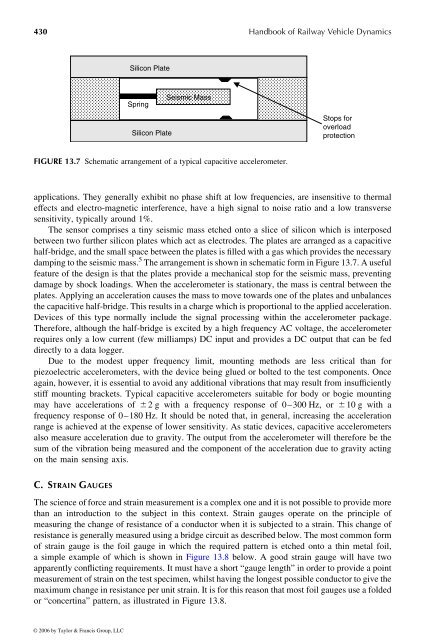
The sensor comprises atiny seismic mass etched onto aslice <strong>of</strong> silicon which is interposed<br />
between two further silicon plates which act as electrodes. The plates are arranged as acapacitive<br />
half-bridge, and the small space betweenthe plates is filled with agas which provides the necessary<br />
damping to the seismic mass. 5 Thearrangementisshown in schematic form in Figure13.7.Auseful<br />
feature <strong>of</strong>the design is that the plates provide amechanical stop for the seismic mass, preventing<br />
damage by shock loadings. When the accelerometer isstationary, the mass iscentral between the<br />
plates.Applying an acceleration causes the mass to move towards one <strong>of</strong> the plates and unbalances<br />
the capacitive half-bridge. This results in acharge which is proportional to the applied acceleration.<br />
Devices <strong>of</strong> this type normally include the signal processing within the accelerometer package.<br />
Therefore, although the half-bridge is excited by ahigh frequency ACvoltage, the accelerometer<br />
requires only alow current (few milliamps) DC input and provides aDCoutput that can be fed<br />
directly to adata logger.<br />
Due to the modest upper frequency limit, mounting methods are less critical than for<br />
piezoelectric accelerometers, with the device being glued orbolted to the test components. Once<br />
again, however, it is essential to avoid any additional vibrations that may result from insufficiently<br />
stiff mounting brackets. Typical capacitive accelerometers suitable for body or bogie mounting<br />
may have accelerations <strong>of</strong> ^ 2g with afrequency response <strong>of</strong> 0–300 Hz, or ^ 10 gwith a<br />
frequency response <strong>of</strong> 0–180 Hz. It should benoted that, in general, increasing the acceleration<br />
range is achieved at the expense <strong>of</strong>lower sensitivity. Asstatic devices, capacitive accelerometers<br />
also measure acceleration due to gravity. The output from the accelerometer will therefore be the<br />
sum <strong>of</strong> the vibration being measured and the component <strong>of</strong> the acceleration due togravity acting<br />
on the main sensing axis.<br />
C. S TRAIN G AUGES<br />
Silicon Plate<br />
Spring<br />
Silicon Plate<br />
Seismic Mass<br />
FIGURE 13.7 Schematic arrangement <strong>of</strong> atypical capacitive accelerometer.<br />
<strong>Handbook</strong> <strong>of</strong> <strong>Railway</strong> <strong>Vehicle</strong> <strong>Dynamics</strong><br />
Stops for<br />
overload<br />
protection<br />
The science <strong>of</strong> force and strain measurement is acomplexone and it is not possibletoprovide more<br />
than an introduction to the subject in this context. Strain gauges operate on the principle <strong>of</strong><br />
measuring the change <strong>of</strong> resistance <strong>of</strong>aconductor when it is subjected to astrain. This change <strong>of</strong><br />
resistanceisgenerally measured using abridge circuit as described below. Themost common form<br />
<strong>of</strong> strain gauge is the foil gauge in which the required pattern is etched onto athin metal foil,<br />
asimple example <strong>of</strong>which is shown inFigure 13.8 below. Agood strain gauge will have two<br />
apparently conflicting requirements. It musthave ashort “gauge length” in order to provide apoint<br />
measurement <strong>of</strong> strain on the test specimen, whilsthaving the longest possibleconductor to give the<br />
maximum change in resistance per unit strain. It is for this reason that mostfoil gauges use afolded<br />
or “concertina” pattern, as illustrated in Figure 13.8.<br />
© 2006 by Taylor & Francis Group, LLC