Annual Report 2003 - Hannover Re
Annual Report 2003 - Hannover Re
Annual Report 2003 - Hannover Re

You also want an ePaper? Increase the reach of your titles
YUMPU automatically turns print PDFs into web optimized ePapers that Google loves.
Notes<br />
notes on the individual items<br />
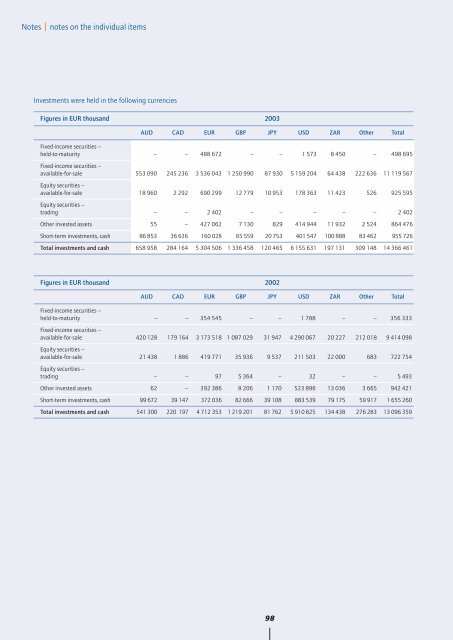
Investments were held in the following currencies<br />
Figures in EUR thousand <strong>2003</strong><br />
AUD CAD EUR GBP JPY USD ZAR Other Total<br />
Fixed-income securities –<br />
held-to-maturity – – 488 672 – – 1 573 8 450 – 498 695<br />
Fixed-income securities –<br />
available-for-sale 553 090 245 236 3 536 043 1 250 990 87 930 5 159 204 64 438 222 636 11 119 567<br />
Equity securities –<br />
available-for-sale 18 960 2 292 690 299 12 779 10 953 178 363 11 423 526 925 595<br />
Equity securities –<br />
trading – – 2 402 – – – – – 2 402<br />
Other invested assets 55 – 427 062 7 130 829 414 944 11 932 2 524 864 476<br />
Short-term investments, cash 86 853 36 636 160 028 65 559 20 753 401 547 100 888 83 462 955 726<br />
Total investments and cash 658 958 284 164 5 304 506 1 336 458 120 465 6 155 631 197 131 309 148 14 366 461<br />
Figures in EUR thousand 2002<br />
AUD CAD EUR GBP JPY USD ZAR Other Total<br />
Fixed-income securities –<br />
held-to-maturity – – 354 545 – – 1 788 – – 356 333<br />
Fixed-income securities –<br />
available-for-sale 420 128 179 164 3 173 518 1 087 029 31 947 4 290 067 20 227 212 018 9 414 098<br />
Equity securities –<br />
available-for-sale 21 438 1 886 419 771 35 936 9 537 211 503 22 000 683 722 754<br />
Equity securities –<br />
trading – – 97 5 364 – 32 – – 5 493<br />
Other invested assets 62 – 392 386 8 206 1 170 523 896 13 036 3 665 942 421<br />
Short-term investments, cash 99 672 39 147 372 036 82 666 39 108 883 539 79 175 59 917 1 655 260<br />
Total investments and cash 541 300 220 197 4 712 353 1 219 201 81 762 5 910 825 134 438 276 283 13 096 359<br />
98