Annual Report 2003 - Hannover Re
Annual Report 2003 - Hannover Re
Annual Report 2003 - Hannover Re

You also want an ePaper? Increase the reach of your titles
YUMPU automatically turns print PDFs into web optimized ePapers that Google loves.
Management report<br />
risk report<br />
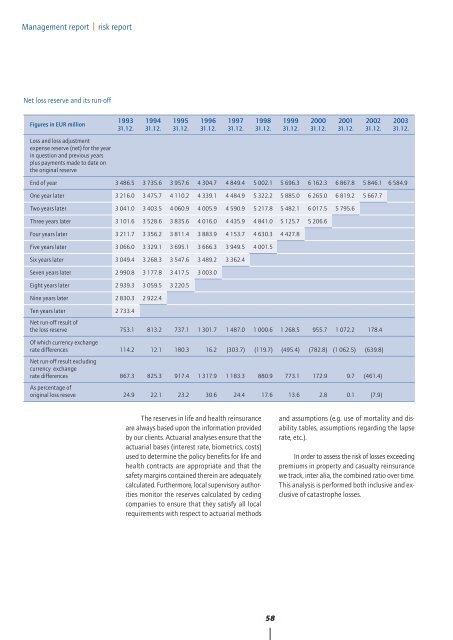
Net loss reserve and its run-off<br />
Figures in EUR million<br />
1993<br />
31.12.<br />
1994<br />
31.12.<br />
1995<br />
31.12.<br />
1996<br />
31.12.<br />
1997<br />
31.12.<br />
1998<br />
31.12.<br />
1999<br />
31.12.<br />
2000<br />
31.12.<br />
2001<br />
31.12.<br />
2002<br />
31.12.<br />
<strong>2003</strong><br />
31.12.<br />
Loss and loss adjustment<br />
expense reserve (net) for the year<br />
in question and previous years<br />
plus payments made to date on<br />
the original reserve<br />
End of year 3 486.5 3 735.6 3 957.6 4 304.7 4 849.4 5 002.1 5 696.3 6 162.3 6 867.8 5 846.1 6 584.9<br />
One year later 3 216.0 3 475.7 4 110.2 4 339.1 4 484.9 5 322.2 5 885.0 6 265.0 6 819.2 5 667.7<br />
Two years later 3 041.0 3 403.5 4 060.9 4 005.9 4 590.9 5 217.8 5 482.1 6 017.5 5 795.6<br />
Three years later 3 101.6 3 528.6 3 835.6 4 016.0 4 435.9 4 841.0 5 125.7 5 206.6<br />
Four years later 3 211.7 3 356.2 3 811.4 3 883.9 4 153.7 4 630.3 4 427.8<br />
Five years later 3 066.0 3 329.1 3 695.1 3 666.3 3 949.5 4 001.5<br />
Six years later 3 049.4 3 268.3 3 547.6 3 489.2 3 362.4<br />
Seven years later 2 990.8 3 177.8 3 417.5 3 003.0<br />
Eight years later 2 939.3 3 059.5 3 220.5<br />
Nine years later 2 830.3 2 922.4<br />
Ten years later 2 733.4<br />
Net run-off result of<br />
the loss reserve 753.1 813.2 737.1 1 301.7 1 487.0 1 000.6 1 268.5 955.7 1 072.2 178.4<br />
Of which currency exchange<br />
rate differences 114.2 12.1 180.3 16.2 (303.7) (119.7) (495.4) (782.8) (1 062.5) (639.8)<br />
Net run-off result excluding<br />
currency exchange<br />
rate differences 867.3 825.3 917.4 1 317.9 1 183.3 880.9 773.1 172.9 9.7 (461.4)<br />
As percentage of<br />
original loss reseve 24.9 22.1 23.2 30.6 24.4 17.6 13.6 2.8 0.1 (7.9)<br />
The reserves in life and health reinsurance<br />
are always based upon the information provided<br />
by our clients. Actuarial analyses ensure that the<br />
actuarial bases (interest rate, biometrics, costs)<br />
used to determine the policy benefits for life and<br />
health contracts are appropriate and that the<br />
safety margins contained therein are adequately<br />
calculated. Furthermore, local supervisory authorities<br />
monitor the reserves calculated by ceding<br />
companies to ensure that they satisfy all local<br />
requirements with respect to actuarial methods<br />
and assumptions (e.g. use of mortality and disability<br />
tables, assumptions regarding the lapse<br />
rate, etc.).<br />
In order to assess the risk of losses exceeding<br />
premiums in property and casualty reinsurance<br />
we track, inter alia, the combined ratio over time.<br />
This analysis is performed both inclusive and exclusive<br />
of catastrophe losses.<br />
58