Annual Report 2003 - Hannover Re
Annual Report 2003 - Hannover Re
Annual Report 2003 - Hannover Re

Create successful ePaper yourself
Turn your PDF publications into a flip-book with our unique Google optimized e-Paper software.
Notes<br />
notes on the individual items<br />
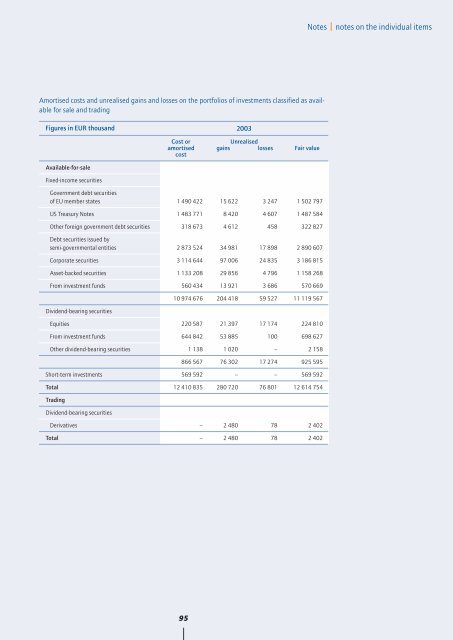
Amortised costs and unrealised gains and losses on the portfolios of investments classified as available<br />
for sale and trading<br />
Figures in EUR thousand <strong>2003</strong><br />
Cost or<br />
amortised<br />
cost<br />
Unrealised<br />
gains<br />
losses<br />
Fair value<br />
Available-for-sale<br />
Fixed-income securities<br />
Government debt securities<br />
of EU member states 1 490 422 15 622 3 247 1 502 797<br />
US Treasury Notes 1 483 771 8 420 4 607 1 487 584<br />
Other foreign government debt securities 318 673 4 612 458 322 827<br />
Debt securities issued by<br />
semi-governmental entities 2 873 524 34 981 17 898 2 890 607<br />
Corporate securities 3 114 644 97 006 24 835 3 186 815<br />
Asset-backed securities 1 133 208 29 856 4 796 1 158 268<br />
From investment funds 560 434 13 921 3 686 570 669<br />
Dividend-bearing securities<br />
10 974 676 204 418 59 527 11 119 567<br />
Equities 220 587 21 397 17 174 224 810<br />
From investment funds 644 842 53 885 100 698 627<br />
Other dividend-bearing securities 1 138 1 020 – 2 158<br />
866 567 76 302 17 274 925 595<br />
Short-term investments 569 592 – – 569 592<br />
Total 12 410 835 280 720 76 801 12 614 754<br />
Trading<br />
Dividend-bearing securities<br />
Derivatives – 2 480 78 2 402<br />
Total – 2 480 78 2 402<br />
95