

Annual Report 2010 - Hannover Re
Annual Report 2010 - Hannover Re
Annual Report 2010 - Hannover Re

Create successful ePaper yourself
Turn your PDF publications into a flip-book with our unique Google optimized e-Paper software.
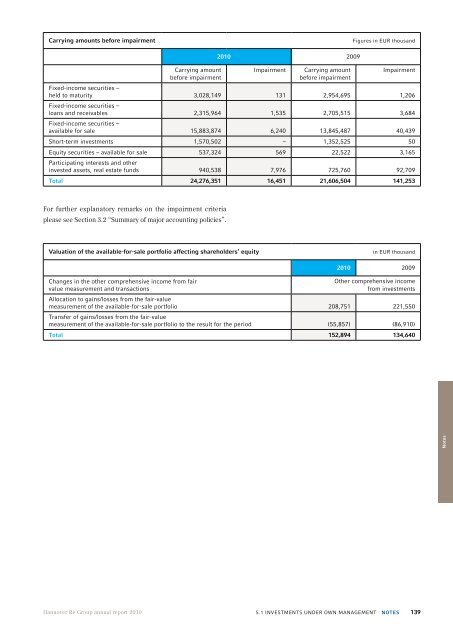
Carrying amounts before impairment<br />
Figures in EUR thousand<br />
Carrying amount<br />
before impairment<br />
<strong>2010</strong> 2009<br />
Impairment<br />
Carrying amount<br />
before impairment<br />
Impairment<br />
Fixed-income securities –<br />
held to maturity 3,028,149 131 2,954,695 1,206<br />
Fixed-income securities –<br />
loans and receivables 2,315,964 1,535 2,705,515 3,684<br />
Fixed-income securities –<br />
available for sale 15,883,874 6,240 13,845,487 40,439<br />
Short-term investments 1,570,502 – 1,352,525 50<br />
Equity securities – available for sale 537,324 569 22,522 3,165<br />
Participating interests and other<br />
invested assets, real estate funds 940,538 7,976 725,760 92,709<br />
Total 24,276,351 16,451 21,606,504 141,253<br />
For further explanatory remarks on the impairment criteria<br />
please see Section 3.2 “Summary of major accounting policies”.<br />
Valuation of the available-for-sale portfolio affecting shareholders‘ equity<br />
in EUR thousand<br />
Changes in the other comprehensive income from fair<br />
value measurement and transactions<br />
<strong>2010</strong> 2009<br />
Other comprehensive income<br />
from investments<br />
Allocation to gains/losses from the fair-value<br />
measurement of the available-for-sale portfolio 208,751 221,550<br />
Transfer of gains/losses from the fair-value<br />
measurement of the available-for-sale portfolio to the result for the period (55,857) (86,910)<br />
Total 152,894 134,640<br />
Notes<br />
<strong>Hannover</strong> <strong>Re</strong> Group annual report <strong>2010</strong><br />
5.1 investments under own management Notes<br />
139


