Forest Condition in Europe - ICP Forests
Forest Condition in Europe - ICP Forests
Forest Condition in Europe - ICP Forests

Create successful ePaper yourself
Turn your PDF publications into a flip-book with our unique Google optimized e-Paper software.
100 <strong>Forest</strong> <strong>Condition</strong> <strong>in</strong> <strong>Europe</strong> 2013<br />
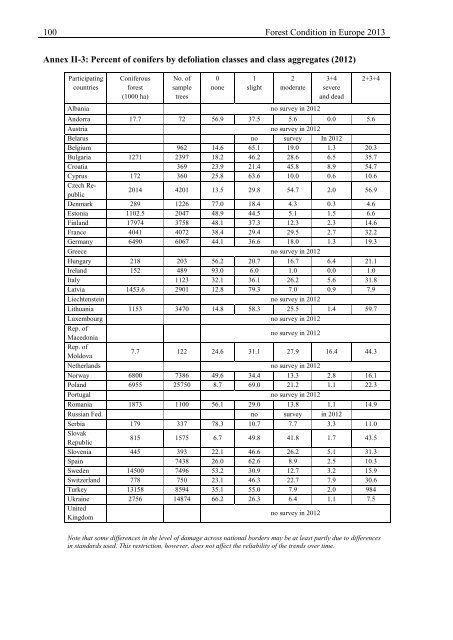
Annex II-3: Percent of conifers by defoliation classes and class aggregates (2012)<br />
Participat<strong>in</strong>g<br />
countries<br />
Coniferous<br />
forest<br />
(1000 ha)<br />
No. of<br />
sample<br />
trees<br />
0<br />
none<br />
1<br />
slight<br />
2<br />
moderate<br />
Albania no survey <strong>in</strong> 2012<br />
3+4<br />
severe<br />
and dead<br />
2+3+4<br />
Andorra 17.7 72 56.9 37.5 5.6 0.0 5.6<br />
Austria no survey <strong>in</strong> 2012<br />
Belarus no survey In 2012<br />
Belgium 962 14.6 65.1 19.0 1.3 20.3<br />
Bulgaria 1271 2397 18.2 46.2 28.6 6.5 35.7<br />
Croatia 369 23.9 21.4 45.8 8.9 54.7<br />
Cyprus 172 360 25.8 63.6 10.0 0.6 10.6<br />
Czech Republic<br />
2014 4201 13.5 29.8 54.7 2.0 56.9<br />
Denmark 289 1226 77.0 18.4 4.3 0.3 4.6<br />
Estonia 1102.5 2047 48.9 44.5 5.1 1.5 6.6<br />
F<strong>in</strong>land 17974 3758 48.1 37.3 12.3 2.3 14.6<br />
France 4041 4072 38.4 29.4 29.5 2.7 32.2<br />
Germany 6490 6067 44.1 36.6 18.0 1.3 19.3<br />
Greece no survey <strong>in</strong> 2012<br />
Hungary 218 203 56.2 20.7 16.7 6.4 21.1<br />
Ireland 152 489 93.0 6.0 1.0 0.0 1.0<br />
Italy 1123 32.1 36.1 26.2 5.6 31.8<br />
Latvia 1453.6 2901 12.8 79.3 7.0 0.9 7.9<br />
Liechtenste<strong>in</strong> no survey <strong>in</strong> 2012<br />
Lithuania 1153 3470 14.8 58.3 25.5 1.4 59.7<br />
Luxembourg no survey <strong>in</strong> 2012<br />
Rep. of<br />
Macedonia<br />
no survey <strong>in</strong> 2012<br />
Rep. of<br />
Moldova<br />
7.7 122 24.6 31.1 27.9 16.4 44.3<br />
Netherlands no survey <strong>in</strong> 2012<br />
Norway 6800 7386 49.6 34.4 13.3 2.8 16.1<br />
Poland 6955 25750 8.7 69.0 21.2 1.1 22.3<br />
Portugal no survey <strong>in</strong> 2012<br />
Romania 1873 1100 56.1 29.0 13.8 1.1 14.9<br />
Russian Fed. no survey <strong>in</strong> 2012<br />
Serbia 179 337 78.3 10.7 7.7 3.3 11.0<br />
Slovak<br />
Republic<br />
815 1575 6.7 49.8 41.8 1.7 43.5<br />
Slovenia 445 393 22.1 46.6 26.2 5.1 31.3<br />
Spa<strong>in</strong> 7438 26.0 62.6 8.9 2.5 10.3<br />
Sweden 14500 7496 53.2 30.9 12.7 3.2 15.9<br />
Switzerland 778 750 23.1 46.3 22.7 7.9 30.6<br />
Turkey 13158 8594 35.1 55.0 7.9 2.0 984<br />
Ukra<strong>in</strong>e 2756 14874 66.2 26.3 6.4 1.1 7.5<br />
United<br />
K<strong>in</strong>gdom<br />
no survey <strong>in</strong> 2012<br />
Note that some differences <strong>in</strong> the level of damage across national borders may be at least partly due to differences<br />
<strong>in</strong> standards used. This restriction, however, does not affect the reliability of the trends over time.