Forest Condition in Europe - ICP Forests
Forest Condition in Europe - ICP Forests
Forest Condition in Europe - ICP Forests

You also want an ePaper? Increase the reach of your titles
YUMPU automatically turns print PDFs into web optimized ePapers that Google loves.
1993<br />
1994<br />
1995<br />
1996<br />
1997<br />
1998<br />
1999<br />
2000<br />
2001<br />
2002<br />
2003<br />
2004<br />
2005<br />
2006<br />
2007<br />
2008<br />
2009<br />
2010<br />
2011<br />
2012<br />
32 <strong>Forest</strong> <strong>Condition</strong> <strong>in</strong> <strong>Europe</strong> 2013<br />
The spatial pattern of the changes <strong>in</strong> mean defoliation from 2010 to 2012 across <strong>Europe</strong> is<br />
shown <strong>in</strong> Annex I-4. On 77.9% of the plots between 2010 and 2012 no statistically significant<br />
differences <strong>in</strong> mean plot defoliation were detected. The share of plots with <strong>in</strong>creas<strong>in</strong>g defoliation<br />
was 10.7%, the share of plots with a decrease 11.4%.<br />
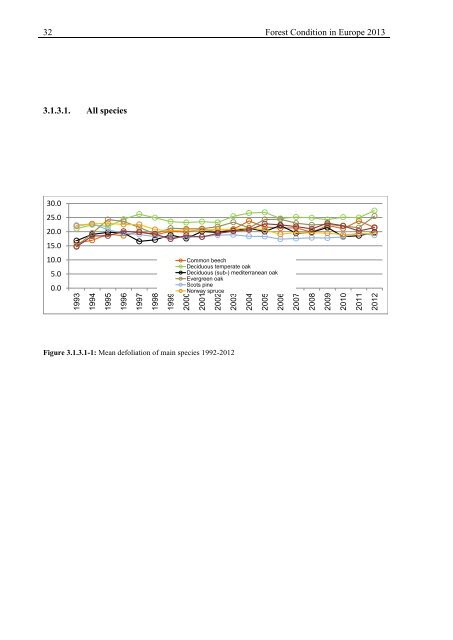
3.1.3.1. All species<br />
For all species, the two time series show very similar trends for mean defoliation due to the<br />
fact that the countries <strong>in</strong>cluded <strong>in</strong> the short time series were also <strong>in</strong>cluded <strong>in</strong> the evaluation of<br />
the long time series (Fig. 3.1.3.1-1 and Fig. 3.1.3.1-2). For evergreen oak and Mediterranean<br />
lowland p<strong>in</strong>es there was hardly any difference <strong>in</strong> sample sizes on which evaluations of the<br />
different time series were based. The largest differences occurred for P<strong>in</strong>us sylvestris and<br />
Picea abies the sample sizes for the long time series be<strong>in</strong>g 70% smaller than that of the shorter<br />
time series.<br />
30.0<br />
25.0<br />
20.0<br />
15.0<br />
10.0<br />
5.0<br />
0.0<br />
Common beech<br />
Deciduous temperate oak<br />
Deciduous (sub-) mediterranean oak<br />
Evergreen oak<br />
Scots p<strong>in</strong>e<br />
Norway spruce<br />
Figure 3.1.3.1-1: Mean defoliation of ma<strong>in</strong> species 1992-2012