Forest Condition in Europe - ICP Forests
Forest Condition in Europe - ICP Forests
Forest Condition in Europe - ICP Forests

You also want an ePaper? Increase the reach of your titles
YUMPU automatically turns print PDFs into web optimized ePapers that Google loves.
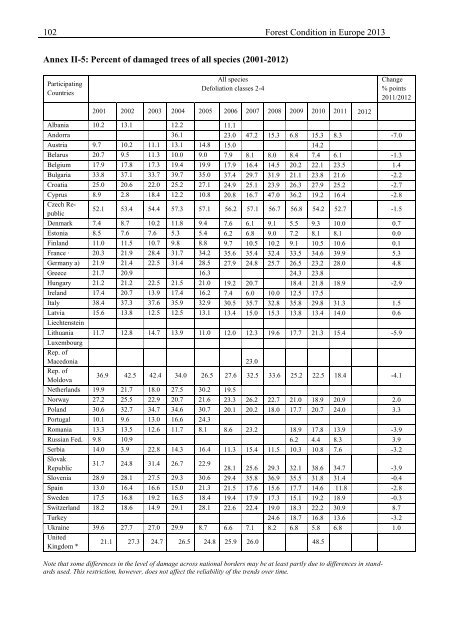
102 <strong>Forest</strong> <strong>Condition</strong> <strong>in</strong> <strong>Europe</strong> 2013<br />
Annex II-5: Percent of damaged trees of all species (2001-2012)<br />
Participat<strong>in</strong>g<br />
Countries<br />
All species<br />
Defoliation classes 2-4<br />
2001 2002 2003 2004 2005 2006 2007 2008 2009 2010 2011 2012<br />
Change<br />
% po<strong>in</strong>ts<br />
2011/2012<br />
Albania 10.2 13.1 12.2 11.1<br />
Andorra 36.1 23.0 47.2 15.3 6.8 15.3 8.3 -7.0<br />
Austria 9.7 10.2 11.1 13.1 14.8 15.0 14.2<br />
Belarus 20.7 9.5 11.3 10.0 9.0 7.9 8.1 8.0 8.4 7.4 6.1 -1.3<br />
Belgium 17.9 17.8 17.3 19.4 19.9 17.9 16.4 14.5 20.2 22.1 23.5 1.4<br />
Bulgaria 33.8 37.1 33.7 39.7 35.0 37.4 29.7 31.9 21.1 23.8 21.6 -2.2<br />
Croatia 25.0 20.6 22.0 25.2 27.1 24.9 25.1 23.9 26.3 27.9 25.2 -2.7<br />
Cyprus 8.9 2.8 18.4 12.2 10.8 20.8 16.7 47.0 36.2 19.2 16.4 -2.8<br />
Czech Republic<br />
52.1 53.4 54.4 57.3 57.1 56.2 57.1 56.7 56.8 54.2 52.7 -1.5<br />
Denmark 7.4 8.7 10.2 11.8 9.4 7.6 6.1 9.1 5.5 9.3 10.0 0.7<br />
Estonia 8.5 7.6 7.6 5.3 5.4 6.2 6.8 9.0 7.2 8.1 8.1 0.0<br />
F<strong>in</strong>land 11.0 11.5 10.7 9.8 8.8 9.7 10.5 10.2 9.1 10.5 10.6 0.1<br />
France · 20.3 21.9 28.4 31.7 34.2 35.6 35.4 32.4 33.5 34.6 39.9 5.3<br />
Germany a) 21.9 21.4 22.5 31.4 28.5 27.9 24.8 25.7 26.5 23.2 28.0 4.8<br />
Greece 21.7 20.9 16.3 24.3 23.8<br />
Hungary 21.2 21.2 22.5 21.5 21.0 19.2 20.7 18.4 21.8 18.9 -2.9<br />
Ireland 17.4 20.7 13.9 17.4 16.2 7.4 6.0 10.0 12.5 17.5<br />
Italy 38.4 37.3 37.6 35.9 32.9 30.5 35.7 32.8 35.8 29.8 31.3 1.5<br />
Latvia 15.6 13.8 12.5 12.5 13.1 13.4 15.0 15.3 13.8 13.4 14.0 0.6<br />
Liechtenste<strong>in</strong><br />
Lithuania 11.7 12.8 14.7 13.9 11.0 12.0 12.3 19.6 17.7 21.3 15.4 -5.9<br />
Luxembourg<br />
Rep. of<br />
Macedonia 23.0<br />
Rep. of<br />
Moldova<br />
36.9 42.5 42.4 34.0 26.5 27.6 32.5 33.6 25.2 22.5 18.4 -4.1<br />
Netherlands 19.9 21.7 18.0 27.5 30.2 19.5<br />
Norway 27.2 25.5 22.9 20.7 21.6 23.3 26.2 22.7 21.0 18.9 20.9 2.0<br />
Poland 30.6 32.7 34.7 34.6 30.7 20.1 20.2 18.0 17.7 20.7 24.0 3.3<br />
Portugal 10.1 9.6 13.0 16.6 24.3<br />
Romania 13.3 13.5 12.6 11.7 8.1 8.6 23.2 18.9 17.8 13.9 -3.9<br />
Russian Fed. 9.8 10.9 6.2 4.4 8.3 3.9<br />
Serbia 14.0 3.9 22.8 14.3 16.4 11.3 15.4 11.5 10.3 10.8 7.6 -3.2<br />
Slovak<br />
31.7 24.8 31.4 26.7 22.9<br />
Republic<br />
28.1 25.6 29.3 32.1 38.6 34.7 -3.9<br />
Slovenia 28.9 28.1 27.5 29.3 30.6 29.4 35.8 36.9 35.5 31.8 31.4 -0.4<br />
Spa<strong>in</strong> 13.0 16.4 16.6 15.0 21.3 21.5 17.6 15.6 17.7 14.6 11.8 -2.8<br />
Sweden 17.5 16.8 19.2 16.5 18.4 19.4 17.9 17.3 15.1 19.2 18.9 -0.3<br />
Switzerland 18.2 18.6 14.9 29.1 28.1 22.6 22.4 19.0 18.3 22.2 30.9 8.7<br />
Turkey 24.6 18.7 16.8 13.6 -3.2<br />
Ukra<strong>in</strong>e 39.6 27.7 27.0 29.9 8.7 6.6 7.1 8.2 6.8 5.8 6.8 1.0<br />
United<br />
K<strong>in</strong>gdom *<br />
21.1 27.3 24.7 26.5 24.8 25.9 26.0 48.5<br />
Note that some differences <strong>in</strong> the level of damage across national borders may be at least partly due to differences <strong>in</strong> standards<br />
used. This restriction, however, does not affect the reliability of the trends over time.