Forest Condition in Europe - ICP Forests
Forest Condition in Europe - ICP Forests
Forest Condition in Europe - ICP Forests

Create successful ePaper yourself
Turn your PDF publications into a flip-book with our unique Google optimized e-Paper software.
percent of trees<br />
<strong>Forest</strong> <strong>Condition</strong> <strong>in</strong> <strong>Europe</strong> 2013 39<br />
3.1.3.4. Mediterranean lowland<br />
p<strong>in</strong>es<br />
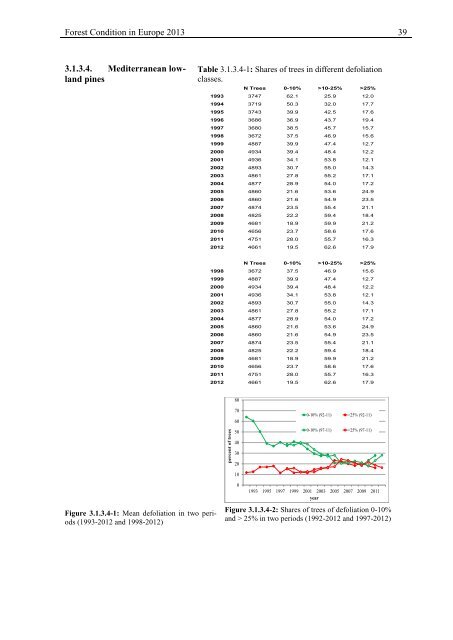
To the group of Mediterranean<br />
lowland p<strong>in</strong>es belong P.. Crown<br />
condition of these tree species is<br />
characterized by a pronounced<br />
<strong>in</strong>crease <strong>in</strong> mean defoliation s<strong>in</strong>ce<br />
1992. This is evident from the<br />
development of healthy trees.<br />
Their share dropped from about<br />
64% <strong>in</strong> 1992 to 27.9% <strong>in</strong> 2012.<br />
The lowest share of undamaged<br />
trees (18.1%) was recorded <strong>in</strong><br />
2009. In contrast to the healthy<br />
trees the percentage of damaged<br />
p<strong>in</strong>es peaked <strong>in</strong> 2005, decreased<br />
thereafter and fluctuated s<strong>in</strong>ce<br />
then reach<strong>in</strong>g about 16% <strong>in</strong> 2012<br />
(Tab. 3.1.3.4-1, Fig. 3.1.3.4-1 and<br />
Fig. 3.1.3.4-2).<br />
As regards the spatial trend, the<br />
share of plots show<strong>in</strong>g recovery<br />
(14.7%) exceeds the share of<br />
plots, on which the mean defoliation<br />
<strong>in</strong>creased between 2002 and<br />
2012 (11.7%). These plots are<br />
ma<strong>in</strong>ly located along the Mediterranean<br />
coast <strong>in</strong> France and <strong>in</strong><br />
northern Spa<strong>in</strong> (Fig. 3.1.3.4-3).<br />
Table 3.1.3.4-1: Shares of trees <strong>in</strong> different defoliation<br />
classes.<br />
N Trees 0-10% >10-25% >25%<br />
1993 3747 62.1 25.9 12.0<br />
1994 3719 50.3 32.0 17.7<br />
1995 3743 39.9 42.5 17.6<br />
1996 3686 36.9 43.7 19.4<br />
1997 3680 38.5 45.7 15.7<br />
1998 3672 37.5 46.9 15.6<br />
1999 4887 39.9 47.4 12.7<br />
2000 4934 39.4 48.4 12.2<br />
2001 4936 34.1 53.8 12.1<br />
2002 4893 30.7 55.0 14.3<br />
2003 4861 27.8 55.2 17.1<br />
2004 4877 28.9 54.0 17.2<br />
2005 4860 21.6 53.6 24.9<br />
2006 4860 21.6 54.9 23.5<br />
2007 4874 23.5 55.4 21.1<br />
2008 4825 22.2 59.4 18.4<br />
2009 4681 18.9 59.9 21.2<br />
2010 4656 23.7 58.6 17.6<br />
2011 4751 28.0 55.7 16.3<br />
2012 4661 19.5 62.6 17.9<br />
N Trees 0-10% >10-25% >25%<br />
1998 3672 37.5 46.9 15.6<br />
1999 4887 39.9 47.4 12.7<br />
2000 4934 39.4 48.4 12.2<br />
2001 4936 34.1 53.8 12.1<br />
2002 4893 30.7 55.0 14.3<br />
2003 4861 27.8 55.2 17.1<br />
2004 4877 28.9 54.0 17.2<br />
2005 4860 21.6 53.6 24.9<br />
2006 4860 21.6 54.9 23.5<br />
2007 4874 23.5 55.4 21.1<br />
2008 4825 22.2 59.4 18.4<br />
2009 4681 18.9 59.9 21.2<br />
2010 4656 23.7 58.6 17.6<br />
2011 4751 28.0 55.7 16.3<br />
2012 4661 19.5 62.6 17.9<br />
80<br />
70<br />
60<br />
50<br />
0-10% (92-11) >25% (92-11)<br />
0-10% (97-11) >25% (97-11)<br />
40<br />
30<br />
20<br />
10<br />
Figure 3.1.3.4-1: Mean defoliation <strong>in</strong> two periods<br />
(1993-2012 and 1998-2012)<br />
0<br />
1993 1995 1997 1999 2001 2003 2005 2007 2009 2011<br />
year<br />
Figure 3.1.3.4-2: Shares of trees of defoliation 0-10%<br />
and > 25% <strong>in</strong> two periods (1992-2012 and 1997-2012)