Forest Condition in Europe - ICP Forests
Forest Condition in Europe - ICP Forests
Forest Condition in Europe - ICP Forests

Create successful ePaper yourself
Turn your PDF publications into a flip-book with our unique Google optimized e-Paper software.
<strong>Forest</strong> <strong>Condition</strong> <strong>in</strong> <strong>Europe</strong> 2013 103<br />
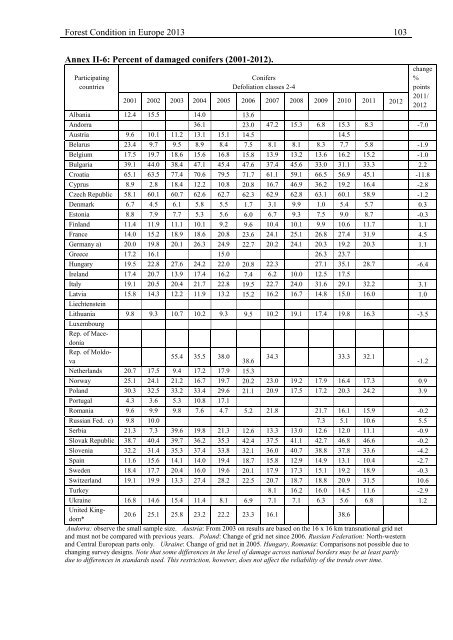
Annex II-6: Percent of damaged conifers (2001-2012).<br />
Participat<strong>in</strong>g<br />
countries<br />
Conifers<br />
Defoliation classes 2-4<br />
2001 2002 2003 2004 2005 2006 2007 2008 2009 2010 2011 2012<br />
change<br />
%<br />
po<strong>in</strong>ts<br />
2011/<br />
2012<br />
Albania 12.4 15.5 14.0 13.6<br />
Andorra 36.1 23.0 47.2 15.3 6.8 15.3 8.3 -7.0<br />
Austria 9.6 10.1 11.2 13.1 15.1 14.5 14.5<br />
Belarus 23.4 9.7 9.5 8.9 8.4 7.5 8.1 8.1 8.3 7.7 5.8 -1.9<br />
Belgium 17.5 19.7 18.6 15.6 16.8 15.8 13.9 13.2 13.6 16.2 15.2 -1.0<br />
Bulgaria 39.1 44.0 38.4 47.1 45.4 47.6 37.4 45.6 33.0 31.1 33.3 2.2<br />
Croatia 65.1 63.5 77.4 70.6 79.5 71.7 61.1 59.1 66.5 56.9 45.1 -11.8<br />
Cyprus 8.9 2.8 18.4 12.2 10.8 20.8 16.7 46.9 36.2 19.2 16.4 -2.8<br />
Czech Republic 58.1 60.1 60.7 62.6 62.7 62.3 62.9 62.8 63.1 60.1 58.9 -1.2<br />
Denmark 6.7 4.5 6.1 5.8 5.5 1.7 3.1 9.9 1.0 5.4 5.7 0.3<br />
Estonia 8.8 7.9 7.7 5.3 5.6 6.0 6.7 9.3 7.5 9.0 8.7 -0.3<br />
F<strong>in</strong>land 11.4 11.9 11.1 10.1 9.2 9.6 10.4 10.1 9.9 10.6 11.7 1.1<br />
France 14.0 15.2 18.9 18.6 20.8 23.6 24.1 25.1 26.8 27.4 31.9 4.5<br />
Germany a) 20.0 19.8 20.1 26.3 24.9 22.7 20.2 24.1 20.3 19.2 20.3 1.1<br />
Greece 17.2 16.1 15.0 26.3 23.7<br />
Hungary 19.5 22.8 27.6 24.2 22.0 20.8 22.3 27.1 35.1 28.7 -6.4<br />
Ireland 17.4 20.7 13.9 17.4 16.2 7.4 6.2 10.0 12.5 17.5<br />
Italy 19.1 20.5 20.4 21.7 22.8 19.5 22.7 24.0 31.6 29.1 32.2 3.1<br />
Latvia 15.8 14.3 12.2 11.9 13.2 15.2 16.2 16.7 14.8 15.0 16.0 1.0<br />
Liechtenste<strong>in</strong><br />
Lithuania 9.8 9.3 10.7 10.2 9.3 9.5 10.2 19.1 17.4 19.8 16.3 -3.5<br />
Luxembourg<br />
Rep. of Macedonia<br />
Rep. of Moldova<br />
38.6<br />
-1.2<br />
55.4 35.5 38.0<br />
34.3 33.3 32.1<br />
Netherlands 20.7 17.5 9.4 17.2 17.9 15.3<br />
Norway 25.1 24.1 21.2 16.7 19.7 20.2 23.0 19.2 17.9 16.4 17.3 0.9<br />
Poland 30.3 32.5 33.2 33.4 29.6 21.1 20.9 17.5 17.2 20.3 24.2 3.9<br />
Portugal 4.3 3.6 5.3 10.8 17.1<br />
Romania 9.6 9.9 9.8 7.6 4.7 5.2 21.8 21.7 16.1 15.9 -0.2<br />
Russian Fed. c) 9.8 10.0 7.3 5.1 10.6 5.5<br />
Serbia 21.3 7.3 39.6 19.8 21.3 12.6 13.3 13.0 12.6 12.0 11.1 -0.9<br />
Slovak Republic 38.7 40.4 39.7 36.2 35.3 42.4 37.5 41.1 42.7 46.8 46.6 -0.2<br />
Slovenia 32.2 31.4 35.3 37.4 33.8 32.1 36.0 40.7 38.8 37.8 33.6 -4.2<br />
Spa<strong>in</strong> 11.6 15.6 14.1 14.0 19.4 18.7 15.8 12.9 14.9 13.1 10.4 -2.7<br />
Sweden 18.4 17.7 20.4 16.0 19.6 20.1 17.9 17.3 15.1 19.2 18.9 -0.3<br />
Switzerland 19.1 19.9 13.3 27.4 28.2 22.5 20.7 18.7 18.8 20.9 31.5 10.6<br />
Turkey 8.1 16.2 16.0 14.5 11.6 -2.9<br />
Ukra<strong>in</strong>e 16.8 14.6 15.4 11.4 8.1 6.9 7.1 7.1 6.3 5.6 6.8 1.2<br />
United K<strong>in</strong>gdom*<br />
20.6 25.1 25.8 23.2 22.2 23.3 16.1 38.6<br />
Andorra: observe the small sample size. Austria: From 2003 on results are based on the 16 x 16 km transnational grid net<br />
and must not be compared with previous years. Poland: Change of grid net s<strong>in</strong>ce 2006. Russian Federation: North-western<br />
and Central <strong>Europe</strong>an parts only. Ukra<strong>in</strong>e: Change of grid net <strong>in</strong> 2005. Hungary, Romania: Comparisons not possible due to<br />
chang<strong>in</strong>g survey designs. Note that some differences <strong>in</strong> the level of damage across national borders may be at least partly<br />
due to differences <strong>in</strong> standards used. This restriction, however, does not affect the reliability of the trends over time.