Forest Condition in Europe - ICP Forests
Forest Condition in Europe - ICP Forests
Forest Condition in Europe - ICP Forests

Create successful ePaper yourself
Turn your PDF publications into a flip-book with our unique Google optimized e-Paper software.
66 <strong>Forest</strong> <strong>Condition</strong> <strong>in</strong> <strong>Europe</strong> 2013<br />
lier years (Granke & Mues, 2010). Data from sites <strong>in</strong> UK and Ireland, not <strong>in</strong>cluded <strong>in</strong> Granke<br />
et al. (2010), show that for ammonia the high deposition regions extends also further to the<br />
West, not only to northern France, but also to central UK and Ireland. In contrast to sulphur,<br />
the regions south of the Alps show relatively high bulk and throughfall deposition of nitrate<br />
and ammonium as well. In the Mediterranean area, relatively high values have been recorded<br />
at some sites <strong>in</strong> Spa<strong>in</strong> and <strong>in</strong> southern France.<br />
4.4.2. Temporal trends<br />
For 87 and 55 sites with throughfall and bulk deposition measurements from 1998 to 2001<br />
respectively, we calculated time series for sulphur and nitrogen. These time series <strong>in</strong>clude the<br />
period 1998 to 2007 for which trend analyses have been carried out by Granke et al. (2010) as<br />
well as the period from 2001 to2010 analysed here. At some few of these sites, the correction<br />
for sea salt could not be performed because chloride data did not meet the mentioned criteria.<br />
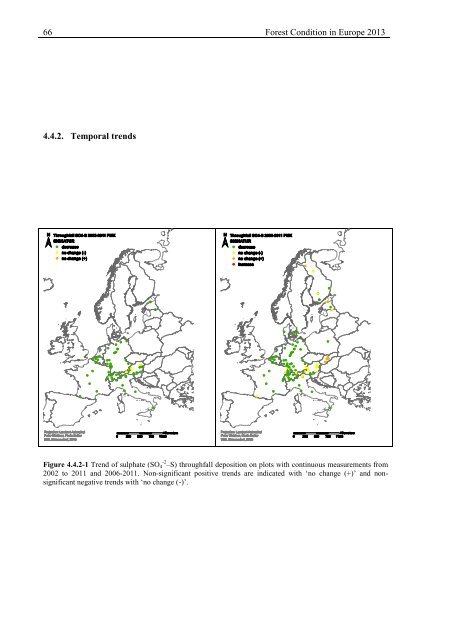
The sulfur deposition showed a decreas<strong>in</strong>g trend for the period from 2001 to 2010 that is detected<br />
by l<strong>in</strong>ear regression as be<strong>in</strong>g significant for the majority of the sites (Figure 4.4.2-1)<br />
Figure 4.4.2-1 Trend of sulphate (SO 4 -2 –S) throughfall deposition on plots with cont<strong>in</strong>uous measurements from<br />
2002 to 2011 and 2006-2011. Non-significant positive trends are <strong>in</strong>dicated with ‘no change (+)’ and nonsignificant<br />
negative trends with ‘no change (-)’.<br />
The mean of the sites with cont<strong>in</strong>uous measurement from 1998 to 2010 decreased from about<br />
10 and 7 kg S ha -1 a -1 to about 5 and 4 kg S ha -1 a -1 (Figure 4.4.2-3) for throughfall and bulk<br />
deposition, respectively. This corresponds to a relative decrease of about 6% per year. However,<br />
for the <strong>in</strong>dividual sites, the mean relative decrease ranged from about 0% to 10% per<br />
year (Figure 4.4.3-1) and low relative decreases have also been estimated for some of the sites<br />
with high sulphur deposition. In comparison, the mean precipitation volume rema<strong>in</strong>ed quite<br />
stable except for the drier year 2003 and, to a lesser extent, 2005.