Forest Condition in Europe - ICP Forests
Forest Condition in Europe - ICP Forests
Forest Condition in Europe - ICP Forests

You also want an ePaper? Increase the reach of your titles
YUMPU automatically turns print PDFs into web optimized ePapers that Google loves.
20 <strong>Forest</strong> <strong>Condition</strong> <strong>in</strong> <strong>Europe</strong> 2013<br />
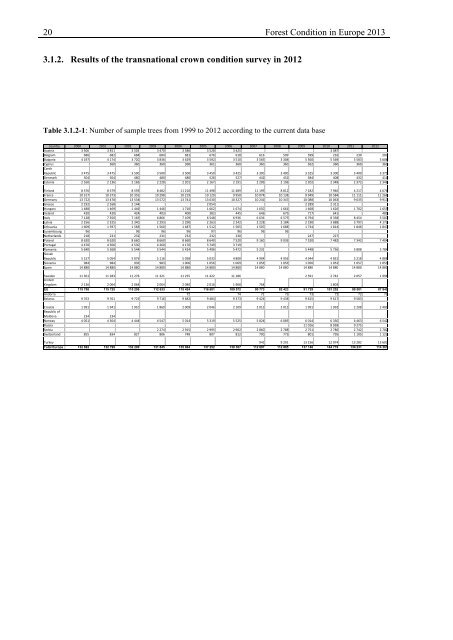
3.1.2. Results of the transnational crown condition survey <strong>in</strong> 2012<br />
On each sampl<strong>in</strong>g po<strong>in</strong>t sample trees were selected accord<strong>in</strong>g to national procedures and assessed<br />
for defoliation. Accord<strong>in</strong>g to Tab. 3.1.2-1 the defoliation assessment was carried out <strong>in</strong><br />
28 countries <strong>in</strong>clud<strong>in</strong>g 135 388 trees. The figures <strong>in</strong> Tab. 3.1.2-1 are not necessarily identical<br />
with those published <strong>in</strong> the reports of the past years s<strong>in</strong>ce <strong>in</strong> case of a restructure of the national<br />
observation networks a resubmission of older data is possible.<br />
Table 3.1.2-1: Number of sample trees from 1999 to 2012 accord<strong>in</strong>g to the current data base<br />
country 2000 2001 2002 2003 2004 2005 2006 2007 2008 2009 2010 2011 2012<br />
Austria 3 506 3 451 3 503 3 470 3 586 3 528 3 425 3 087<br />
Belgium 686 682 684 684 681 676 618 616 599 599 216 230 207<br />
Bulgaria 4 197 4 174 3 720 3 836 3 629 3 592 3 510 3 569 3 304 5 560 5 569 5 583 5 608<br />
Cyprus 360 360 360 360 361 360 360 360 362 360 360 360<br />
Czech<br />
Republic 3 475 3 475 3 500 3 500 3 500 3 450 3 425 3 300 3 400 3 325 3 300 3 400 3 375<br />
Denmark 504 504 480 480 480 528 527 442 452 384 408 432 411<br />
Estonia 2 160 2 136 2 169 2 228 2 201 2 167 2 191 2 209 2 196 2 202 2 348 2 372 2 348<br />
F<strong>in</strong>land 8 576 8 579 8 593 8 482 11 210 11 498 11 489 11 199 8 812 7 182 7 946 4 217 4 676<br />
France 10 317 10 373 10 355 10 298 10 219 10 129 9 950 10 074 10 138 9 949 10 584 11 111 11 268<br />
Germany 13 722 13 478 13 534 13 572 13 741 13 630 10 327 10 241 10 347 10 088 10 063 9 635 9 917<br />
Greece 2 192 2 168 2 144 2 054 2 289 2 311<br />
Hungary 1 488 1 469 1 446 1 446 1 710 1 662 1 674 1 650 1 661 1 668 1 626 1 702 1 655<br />
Ireland 420 420 424 403 400 382 445 646 679 717 641 489<br />
Italy 7 128 7 350 7 165 6 866 7 109 6 548 6 936 6 636 6 579 6 794 8 338 8 454 5 507<br />
Latvia 2 256 2 325 2 340 2 293 2 290 2 263 2 242 2 228 2 184 2 190 3 888 3 797 4 172<br />
Lithuania 1 609 1 597 1 583 1 560 1 487 1 512 1 505 1 507 1 688 1 734 1 814 1 846 1 847<br />
Luxembourg 96 96 96 96 97 96 96 96<br />
Netherlands 218 231 232 231 232 232 230 247 227<br />
Poland 8 620 8 620 8 660 8 660 8 660 8 640 7 520 9 160 9 036 7 520 7 482 7 342 7 404<br />
Portugal 4 470 4 500 4 530 4 260 4 170 3 749 3 719<br />
Romania 5 640 5 568 5 544 5 544 5 424 5 496 5 472 5 232 5 448 5 736 5 808 5 784<br />
Slovak<br />
Republic 5 157 5 054 5 076 5 116 5 058 5 033 4 808 4 904 4 956 4 944 4 831 5 218 4 888<br />
Slovenia 984 984 936 983 1 006 1 056 1 069 1 056 1 056 1 056 1 052 1 057 1 053<br />
Spa<strong>in</strong> 14 880 14 880 14 880 14 880 14 880 14 880 14 880 14 880 14 880 14 880 14 880 14 880 14 880<br />
Sweden 11 361 11 283 11 278 11 321 11 255 11 422 11 186 2 591 2 742 2 057 1 991<br />
United<br />
K<strong>in</strong>gdom 2 136 2 064 2 064 2 064 2 040 2 016 1 968 768 1 803<br />
EU 115 798 115 725 115 296 112 633 115 424 116 601 109 572 90 773 82 423 91 729 101 252 89 501 87 840<br />
Andorra 72 74 72 72 73 72 72 72<br />
Belarus 9 763 9 761 9 723 9 716 9 682 9 484 9 373 9 424 9 438 9 615 9 617 9 583<br />
Croatia 1 991 1 941 1 910 1 869 2 009 2 046 2 109 2 013 2 015 1 991 1 992 2 208 2 400<br />
Republic of<br />
Moldova 234 234<br />
Norway 4 051 4 304 4 444 4 547 5 014 5 319 5 525 5 824 6 085 6 014 6 330 6 463 6 542<br />
Russia 11 016 8 958 9 275<br />
Serbia 2 274 2 915 2 995 2 902 2 860 2 788 2 751 2 786 2 742 2 782<br />
Switzerland 855 834 827 806 748 807 812 790 773 801 795 1 105 1 122<br />
Turkey 941 9 291 13 156 12 974 13 282 13 603<br />
Total <strong>Europe</strong> 132 692 132 799 132 200 131 845 135 864 137 252 130 367 112 697 112 885 137 146 144 776 134 231 114 361<br />
The ma<strong>in</strong> results summarized <strong>in</strong> Tab. 3.1.2-2 show that the mean defoliation of all trees assessed<br />
<strong>in</strong> <strong>Europe</strong> was 19.5%. Broadleaved trees showed a higher mean defoliation (20.4%)<br />
than conifers (18.7%). With a share of 24.4% the deciduous temperate oak is the most damaged<br />
species group followed by the Mediterranean oak (24.2%) and Fagus sylvatica (20.7%).<br />
The spatial distribution of the two species groups depicted <strong>in</strong> Annex I-1 shows that <strong>in</strong> 2012<br />
61.3% of the plots were dom<strong>in</strong>ated by coniferous and 38.7% by broadleaved trees.<br />
The maps <strong>in</strong> Annex I-2 and Annex I-3 <strong>in</strong>dicate that defoliation is highest on plots located <strong>in</strong><br />
central and southern <strong>Europe</strong>. The largest shares (58.0%) are plots with mean defoliation rang<strong>in</strong>g<br />
from 11 to 25%. The percentage of trees damaged i.e. trees defoliated by 25% and more<br />
is relatively low <strong>in</strong> northern <strong>Europe</strong>, whereas clusters of severely damaged trees are found <strong>in</strong><br />
some parts of Czech Republic and France (Annex I-2).