Forest Condition in Europe - ICP Forests
Forest Condition in Europe - ICP Forests
Forest Condition in Europe - ICP Forests

Create successful ePaper yourself
Turn your PDF publications into a flip-book with our unique Google optimized e-Paper software.
percent of trees<br />
<strong>Forest</strong> <strong>Condition</strong> <strong>in</strong> <strong>Europe</strong> 2013 47<br />
3.1.3.8. Evergreen oak<br />
The group of evergreen oaks <strong>in</strong>cludes<br />
Quercus coccifera, Q. ilex, Q. rotundifolia<br />
and Q. suber. As the compositions<br />
of countries on which both time<br />
series are based do not substantially<br />
differ the results presented <strong>in</strong> Table<br />
3.1.3.8-1 are very similar.<br />
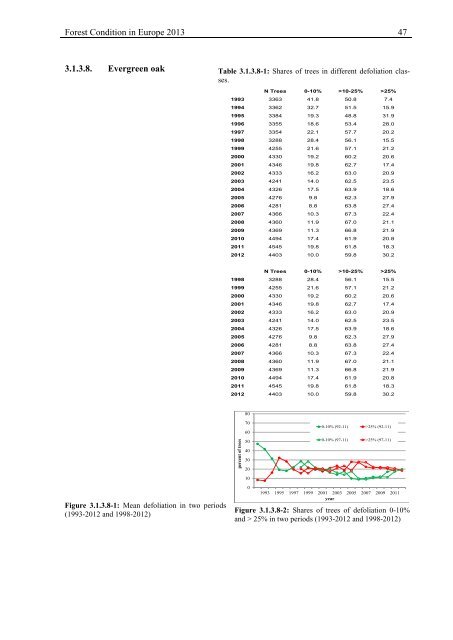
In the early 1990s, at the beg<strong>in</strong>n<strong>in</strong>g of<br />
the study, the mean defoliation of evergreen<br />
oaks was less than 15%, which<br />
corresponds with a high percentage of<br />
healthy trees. The share of damaged<br />
trees (> 25%) shows three peaks: <strong>in</strong><br />
1995 (32.3%), <strong>in</strong> 2005 (27.9%) and <strong>in</strong><br />
2006 (27.3%) (Tab. 3.1.3.8-1).<br />
The majority of plots with evergreen<br />
oaks are located <strong>in</strong> Spa<strong>in</strong>. Few of the<br />
plots are <strong>in</strong> southern France and along<br />
the western coast of Italy. The share of<br />
evergreen oaks with deteriorat<strong>in</strong>g<br />
trends between 2002 and 2012 is with<br />
8.1% rather small. The share of plots<br />
on which these oak species have been<br />
recover<strong>in</strong>g s<strong>in</strong>ce 2002 is by 10% po<strong>in</strong>t<br />
higher (Fig. 3.1.3.8-3).<br />
Table 3.1.3.8-1: Shares of trees <strong>in</strong> different defoliation classes.<br />
N Trees 0-10% >10-25% >25%<br />
1993 3363 41.8 50.8 7.4<br />
1994 3362 32.7 51.5 15.9<br />
1995 3384 19.3 48.8 31.9<br />
1996 3355 18.6 53.4 28.0<br />
1997 3354 22.1 57.7 20.2<br />
1998 3288 28.4 56.1 15.5<br />
1999 4255 21.6 57.1 21.2<br />
2000 4330 19.2 60.2 20.6<br />
2001 4346 19.8 62.7 17.4<br />
2002 4333 16.2 63.0 20.9<br />
2003 4241 14.0 62.5 23.5<br />
2004 4326 17.5 63.9 18.6<br />
2005 4276 9.8 62.3 27.9<br />
2006 4281 8.8 63.8 27.4<br />
2007 4366 10.3 67.3 22.4<br />
2008 4360 11.9 67.0 21.1<br />
2009 4369 11.3 66.8 21.9<br />
2010 4494 17.4 61.9 20.8<br />
2011 4545 19.8 61.8 18.3<br />
2012 4403 10.0 59.8 30.2<br />
N Trees 0-10% >10-25% >25%<br />
1998 3288 28.4 56.1 15.5<br />
1999 4255 21.6 57.1 21.2<br />
2000 4330 19.2 60.2 20.6<br />
2001 4346 19.8 62.7 17.4<br />
2002 4333 16.2 63.0 20.9<br />
2003 4241 14.0 62.5 23.5<br />
2004 4326 17.5 63.9 18.6<br />
2005 4276 9.8 62.3 27.9<br />
2006 4281 8.8 63.8 27.4<br />
2007 4366 10.3 67.3 22.4<br />
2008 4360 11.9 67.0 21.1<br />
2009 4369 11.3 66.8 21.9<br />
2010 4494 17.4 61.9 20.8<br />
2011 4545 19.8 61.8 18.3<br />
2012 4403 10.0 59.8 30.2<br />
80<br />
Figure 3.1.3.8-1: Mean defoliation <strong>in</strong> two periods<br />
(1993-2012 and 1998-2012)<br />
70<br />
60<br />
50<br />
40<br />
30<br />
20<br />
10<br />
0<br />
0-10% (92-11) >25% (92-11)<br />
0-10% (97-11) >25% (97-11)<br />
1993 1995 1997 1999 2001 2003 2005 2007 2009 2011<br />
year<br />
Figure 3.1.3.8-2: Shares of trees of defoliation 0-10%<br />
and > 25% <strong>in</strong> two periods (1993-2012 and 1998-2012)