Forest Condition in Europe - ICP Forests
Forest Condition in Europe - ICP Forests
Forest Condition in Europe - ICP Forests

You also want an ePaper? Increase the reach of your titles
YUMPU automatically turns print PDFs into web optimized ePapers that Google loves.
22 <strong>Forest</strong> <strong>Condition</strong> <strong>in</strong> <strong>Europe</strong> 2013<br />
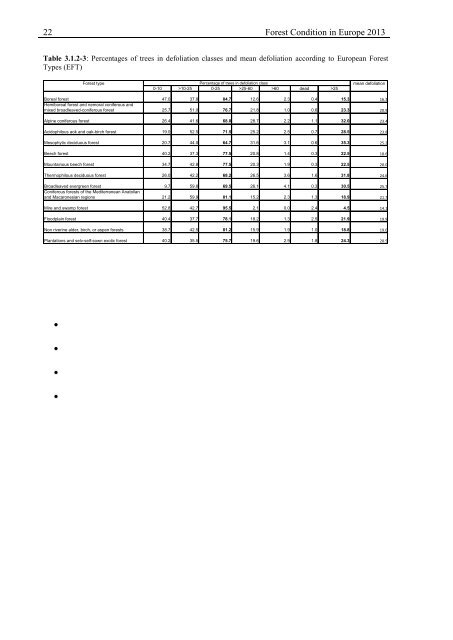
Table 3.1.2-3: Percentages of trees <strong>in</strong> defoliation classes and mean defoliation accord<strong>in</strong>g to <strong>Europe</strong>an <strong>Forest</strong><br />
Types (EFT)<br />
<strong>Forest</strong> type Percentage of trees <strong>in</strong> defoliation class mean defoliation<br />
0-10 >10-25 0-25 >25-60 >60 dead >25<br />
Boreal forest 47.0 37.8 84.7 12.6 2.3 0.4 15.3 16.3<br />
Hemiboreal forest and nemoral coniferous and<br />
mixed broadleaved-coniferous forest 25.7 51.0 76.7 21.8 1.0 0.6 23.3 20.9<br />
Alp<strong>in</strong>e coniferous forest 26.4 41.6 68.0 28.7 2.2 1.1 32.0 23.4<br />
Acidophilous aok and oak-birch forest 19.0 52.5 71.5 25.2 2.5 0.7 28.5 23.8<br />
Mesophytic deciduous forest 20.7 44.0 64.7 31.6 3.1 0.6 35.3 25.2<br />
Beech forest 40.2 37.3 77.5 20.8 1.4 0.3 22.5 18.6<br />
Mounta<strong>in</strong>ous beech forest 34.7 42.8 77.5 20.3 1.9 0.3 22.5 20.0<br />
Thermophilous deciduous forest 26.0 42.2 68.2 26.5 3.6 1.6 31.8 24.6<br />
Broadleaved evergreen forest 9.7 59.8 69.5 26.1 4.1 0.3 30.5 25.7<br />
Coniferous forests of the Mediterranean Anatolian<br />
and Macaronesian regions 21.2 59.9 81.1 15.2 2.3 1.3 18.9 21.7<br />
Mire and swamp forest 52.8 42.7 95.5 2.1 0.0 2.4 4.5 14.1<br />
Floodpla<strong>in</strong> forest 40.4 37.7 78.1 18.2 1.3 2.5 21.9 19.9<br />
Non river<strong>in</strong>e alder, birch, or aspen forests 38.7 42.5 81.2 15.9 1.9 1.0 18.8 19.0<br />
Plantations and selv-self-sown exotic forest 40.2 35.5 75.7 19.6 2.9 1.8 24.3 20.5<br />
In view of the species richness (about 130) recorded with<strong>in</strong> the transnational forest monitor<strong>in</strong>g<br />
only the most abundant species could be evaluated. For other, also important but less abundant<br />
species the follow<strong>in</strong>g groups were created and evaluated <strong>in</strong> this report:<br />
<br />
<br />
<br />
Deciduous temperate oak: (Quercus robur and Q. petraea) account<strong>in</strong>g together for<br />
6.7% of the assessed trees,<br />
Mediterranean lowland p<strong>in</strong>es: (P<strong>in</strong>us brutia, P. p<strong>in</strong>aster, P. halepensis and P. p<strong>in</strong>ea)<br />
account<strong>in</strong>g together for 6.1% of the assessed trees,<br />
Deciduous (sub-) temperate oak: (Quercus fra<strong>in</strong>etto, Q. pubescens, Q. pyrenaica<br />
and Q. cerris) account<strong>in</strong>g together for 5.5% of the assessed trees,<br />
Evergreen oak: (Quercus coccifera, Q. ilex, Q. rotundifolia and Q. suber) account<strong>in</strong>g<br />
together for 3.9% of the assessed trees.<br />
For all evaluations of related to a particular tree species a criterion had to be set up to decide if<br />
a given plot represents this species or not. This criterion was that the number of trees of the<br />
particular species had to be three or more per plot. The mean plot defoliation for the particular<br />
species was then calculated as the mean defoliation of the trees of the species on that plot<br />
based on sample size N ≥ 3.<br />
In Fig. 3.1.2-2 to 3.1.2-8 mean plot defoliation for P<strong>in</strong>us sylvestris, Picea abies, Fagus sylvatica<br />
and the four species groups Deciduous temperate oak, Mediterranean lowland<br />
p<strong>in</strong>es, Deciduous (sub-) temperate oak and Evergreen oak (see above) is mapped. The<br />
spatial distribution of these species and species groups will be described <strong>in</strong> relation to Tab.<br />
3.1.2-2. Accord<strong>in</strong>g to this table the highest level of mean defoliation had deciduous temperate<br />
oaks (24.4%). For the evergreen oaks a mean defoliation of 21.2% (Tab. 3.1.2-2) was calculated<br />
but the majority of the plots namely 71.1% have a mean defoliation ly<strong>in</strong>g between 11<br />
and 25% (Fig. 3.1.2-8).